Download
1 / 44
440 likes | 662 Vues
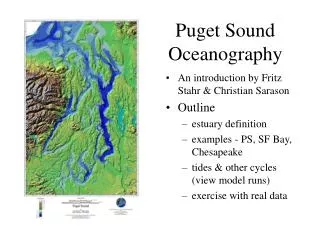
Mid-Range Streamflow Forecasts for River Management in the Puget Sound Region. Richard Palmer Matthew Wiley Department of Civil and Environmental Engineering March 21, 2005. Outline . Region’s Water Supply Basins Models Current Conditions Forecast Methods

E N D
Mid-Range Streamflow Forecasts for River Management in the Puget Sound Region Richard Palmer Matthew Wiley Department of Civil and Environmental Engineering March 21, 2005
Outline • Region’s Water Supply Basins • Models • Current Conditions • Forecast Methods • ESP, Extended Streamflow Prediction • CPC, Climate Predication Center • Current Forecasts • Water Snowpack Modeling • Streamflow Forecasts • Impacts on Storage Special Thanks to the Water Forum for Funding the Mid-Range Forecasts
Hydrologic Model - DHSVM • Physically based, distributed model • Calculates energy and water balance at the grid cell level • 150 meter resolution, 3hr time-step • Station based meteorology • Output streamflows are aggregated to monthly total volume • Recently incorporated an experimental groundwater component
Sultan River • Snohomish PUD Hydropower project • Everett Water Supply • S.F. Tolt River • Seattle Water Supply • Cedar River • Seattle Water Supply • Green River • Flood Control • Tacoma Water Supply • All have environmental flow requirements
Streamflow Forecasts • Initialize basin models to current conditions using recent observed meteorology • ESP (Extended Streamflow Prediction) • Project 13 months into the future using each year in the historic record as one of many possible scenarios (traces). • Forecast can be conditioned using subsets of years based on observed climatologically conditions, such as ENSO state • CPC (Climate Prediction Center) • Seasonal outlooks of the probability of deviations from normal temperature and precipitation for 13 months • Each season's outlook and probability that a temperature or precipitation quantity will be exceeded for a climate region at the given lead time of two weeks to a year.
Modeling Snowpack • DHSVM allows evaluation of snowpack conditions over time • Provides graphical presentation of basin state • Estimate of total water storage as snow • Essential for evaluating the future based on current conditions • Provide spatial information to complement Snotel and Snow Course information
Forecasts Results • USGS 12137290 • SULTAN1: Inflow to Spada • USGS 12147600 • TOLT1: Inflow to SFT • TOLT2: Below SFT • USGS 12115000 • USGS 12117000 • CEDAR1: Inflow to CM • CEDAR2: Below CM • HH_INFLOW: Inflow to Howard Hansen
Implications to Water Supplies • Factors to Consider • Current storage • Inflows to reservoirs • Inflows below reservoirs that contribute to fish requirements • Average demand and effect of conservation • Availability of supplemental groundwater supplies • “Normal” versus “Low” versus “Critical” instream flows • Examined Seattle and Tacoma systems
Implications for Puget Sound Water Supply Systems • Inflows to reservoirs expected to be only 40% to 50% of average, slightly higher in the Everett system. • 60% chance of the Seattle system not completely refilling this spring ( ~32 billion gal.) • 10% chance of the Tacoma system not completely refilling this spring (~10 billion gal.) • If NO action is taken: • (i.e. “Normal fish flows, average demand) • 10%-15% of shortfall by October.
Implications for Puget Sound Water Supply Systems • A 10% reduction in consumption reduces probability to around 5% chance of shortfall • Current snowpack is only half of the picture, spring rains can also refill reservoirs • 10-12 inches* (at Seatac) between March 1 and July 1 will get us to near average storage by September 1 *(Average precip is 9.5 inches) • In an average year there is a considerable “surplus” of water in the basins
Implications for Puget Sound Water Supply Systems • Actions have already being taken • Actual operations are very dynamic with considerable flexibility and continual adjustments based on evolving conditions • Minimizing ecological damage and preventing disruptions to customers are primary goals • A “serious” situation requires several events (low snow pack, below average summer flows, late return of rain)