Download
1 / 23
230 likes | 389 Vues
Using UV/Vis and IR light to Interrogate surfaces. • UV-Vis spectra can be obtained on quartz slides by transmission or reflectance • Spectroscopic ellipsometry can provide film thickness • IR spectra of surfaces usually obtained by reflectance

E N D
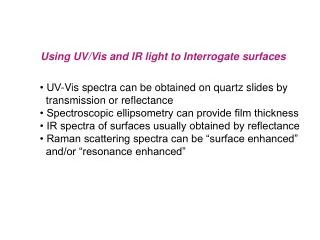
Using UV/Vis and IR light to Interrogate surfaces • UV-Vis spectra can be obtained on quartz slides by transmission or reflectance • Spectroscopic ellipsometry can provide film thickness • IR spectra of surfaces usually obtained by reflectance • Raman scattering spectra can be “surface enhanced” and/or “resonance enhanced”
http://images.google.com/imgres?imgurl=http://www1.chm.colostate.edu/Images/Ellipsometry/Ellipsometry.jpg&imgrefurl=http://www1.chm.colostate.edu/ellipsometry.html&usg=__EieQLybL-o_gMU8vG_svVy1Spgs=&h=540&w=720&sz=110&hl=en&start=3&tbnid=2JesFb5Rp6xsfM:&tbnh=105&tbnw=140&prev=/images%3Fq%3Dspectroscopic%2Belipsometry%26gbv%3D2%26hl%3Den%26client%3Dfirefox-a%26rls%3Dorg.mozilla:en-US:official%26sa%3DGhttp://images.google.com/imgres?imgurl=http://www1.chm.colostate.edu/Images/Ellipsometry/Ellipsometry.jpg&imgrefurl=http://www1.chm.colostate.edu/ellipsometry.html&usg=__EieQLybL-o_gMU8vG_svVy1Spgs=&h=540&w=720&sz=110&hl=en&start=3&tbnid=2JesFb5Rp6xsfM:&tbnh=105&tbnw=140&prev=/images%3Fq%3Dspectroscopic%2Belipsometry%26gbv%3D2%26hl%3Den%26client%3Dfirefox-a%26rls%3Dorg.mozilla:en-US:official%26sa%3DG
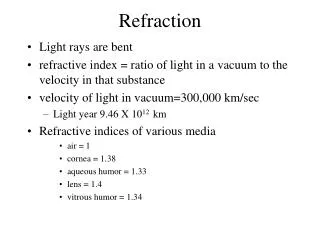
Ellipsometry is a sensitive optical technique for determining properties of surfaces and thin films. If linearly polarized light of a known orientation is reflected at oblique incidence from a surface then the reflected light is elliptically polarized. The shape and orientation of the ellipse depend on the angle of incidence, the direction of the polarization of the incident light, and the reflection properties of the surface. Modeling the data gives film thickness. (Source; see previous slide)
= measured elliptical angle; = incidence angle of light on sample d = 173 nm
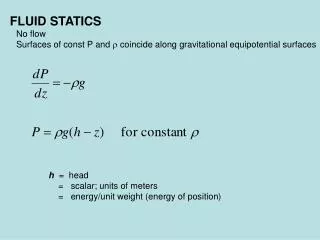
Film characterization - Quartz Crystal Microbalance (QCM) Oscillation freq. ~ (mass)-1 • Adsorbed layer mass and thickness M/A (g cm-2) = -ΔF (Hz) / (1.83 x 10⁸) d (nm) ≈ - (-0.016±0.002) ΔF (Hz) Ru = RuPVP polymer
Reflectance-absorbance IR spectroscopy http://research.chem.ucr.edu/groups/zaera/images/projects/ProjectO5/projO5fig1.gif
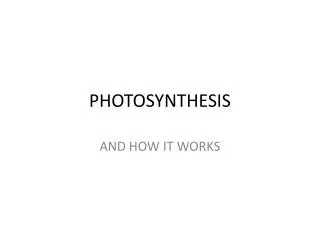
Amide I & II RAIR of Myoglobin- DDAB films CH2 bending DDAB
From RAIR analysis of angular dependence - HC chains oriented ~30o to normal
http://fizz.phys.dal.ca/~hewitt/Images/Research_Tools/T64000_Raman_triple_/T64000%20Raman%20Triple%20Grating%20Spectrometer.JPGhttp://fizz.phys.dal.ca/~hewitt/Images/Research_Tools/T64000_Raman_triple_/T64000%20Raman%20Triple%20Grating%20Spectrometer.JPG
Resonance Raman Spectroscopy Up to 106 enhancement in signal
Identification of micro-organisms by Resonance Raman Resonance Raman excitation in the UV-range to obtain selectively enhanced signals of DNA/RNA and aromatic amino acids (see Figure 1). Juergen Popp. Biomedical Optics & Medical Imaging, Identification of micro-organisms by Raman spectroscopy,5 September 2007, SPIE Newsroom. DOI: 10.1117/2.1200708.0856 http://images.google.com/imgres?imgurl=http://www.spie.org/Images/Graphics/Newsroom/Imported/0856/0856_fig1.jpg&imgrefurl=http://spie.org/x16083.xml%3Fhighlight%3Dx2416&usg=__1Bv0gGpEHM5NG35ziyiUEnAL664=&h=1796&w=2591&sz=1926&hl=en&start=18&um=1&tbnid=SCv9PVsQsc9eyM:&tbnh=104&tbnw=150&prev=/images%3Fq%3Dresonance%2Braman%2Bimages%26hl%3Den%26client%3Dfirefox-a%26channel%3Ds%26rls%3Dorg.mozilla:en-US:official%26sa%3DG%26um%3D1
Carbon Nanotubes Mildred S. Dresselhaus; Ado JorioI; Marcos A. PimentaI, Anais da Academia Brasileira de Ciências. vol.78 no.3 Rio de Janeiro Sept. 2006 doi: 10.1590/S0001-37652006000300004 Resonance Raman spectroscopy in one-dimensional carbon materials
Surface enhanced Raman spectroscopy Rough Au surface Au or Ag NPs
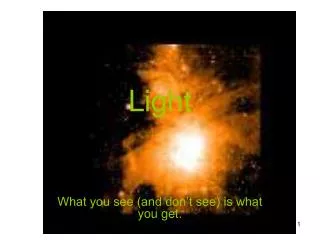
Figure 1. Surface-enhanced Raman spectra of 1-methyl adenine (10−5 mol L−1) in presence of a silver hydrosol prepared by the reduction of [Ag(NH3)2]+ with D(+)−xylose. The average particle size is 55nm. Silver hydrosols were activated by 0.002 (A), 0.01 (B), and 0.1 mol L−1 (C) of NaCl. The Raman spectrum of 1−methyl adenine (10−2 mol L−1) in deionised water (D) is included for comparison purposes. Jana Soukupová, Robert Prucek, Libor Kvítek, and Aleš Panáček Improving the molecular specificity of surface-enhanced Raman spectroscopy The synthesis of silver colloid particles with controlled size significantly increases the application range of surface-enhanced Raman spectroscopy. 23 September 2007, SPIE Newsroom. DOI: 10.1117/2.1200709.0835 http://images.google.com/imgres?imgurl=http://www.spie.org/Images/Graphics/Newsroom/Imported/0835/0835_fig1.jpg&imgrefurl=http://spie.org/x16534.xml&usg=__EYBz_DFGqRi0cOGfQ0eYEDcXz9o=&h=3018&w=1803&sz=449&hl=en&start=114&um=1&tbnid=UPFtQwE5tVI1M:&tbnh=150&tbnw=90&prev=/images%3Fq%3Dresonance%2Braman%2Bspectra%26ndsp%3D20%26hl%3Den%26client%3Dfirefox-a%26channel%3Ds%26rls%3Dorg.mozilla:en-US:official%26sa%3DN%26start%3D100%26um%3D1
cancer imaging with Raman Two different boosters were used - gold-based nanoparticles and carbon nanotubes - which were attached to a tumour-seeking peptide and tracked as they moved around the body S. Keren et al, Proc. Natl. Acad. Sci., 2008, DOI: 10.1073/pnas.0710575105 M Schipper et al, Nat. Nanotech., 2008, DOI:10.1038/nnano.2008.68 http://images.google.com/imgres?imgurl=http://www.rsc.org/images/raman_tcm18117051.gif&imgrefurl=http://www.rsc.org/chemistryworld/News/2008/April/01040802.asp&usg=__mkDH_ulxqFmOQjgpii124KXeY=&h=366&w=350&sz=42&hl=en&start=15&um=1&tbnid=ihqOw55KJBi_iM:&tbnh=122&tbnw=117&prev=/images%3Fq%3DRaman%2BSpectroscopy%2BImages%2Band%2BCancer%2BDetection%26hl%3Den%26client%3Dfirefox-a%26channel%3Ds%26rls%3Dorg.mozilla:en-US:official%26sa%3DG%26um%3D1