Download
1 / 21
210 likes | 359 Vues
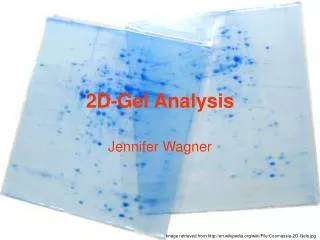
Demonstration of 2 -DE gel analysis procedure. Virtual proteomics laboratory IIT-Bombay. Part – I How to analyze the gels?. Work flow of gel analysis with commercially available software. 1.Set up Project 2. Detect spots 3.Addition and deletion of spots 4.Analyse Expression Profiles

E N D
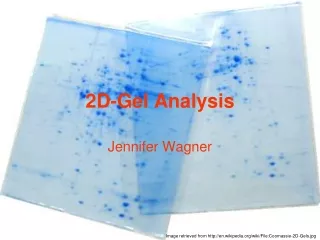
Demonstration of 2-DE gel analysis procedure Virtual proteomics laboratory IIT-Bombay
Part – I How to analyze the gels?
Work flow of gel analysis with commercially available software 1.Set up Project 2. Detect spots 3.Addition and deletion of spots 4.Analyse Expression Profiles 5.Present Results
Layout of 2-D gel analysis software showing various tools Zoom tool 3-D graphical representation Spot analysis Image overlaying File Edit Tools View Reports Crop tool Gel1 - Control Gel2 - Treatment Gel1 Gel2
1. SET UP PROJECT Create a project for analysis.
3. Detection of spots File Edit Tools View Reports Report Crop gels Detect spots Match gels 8 Gel1 - Control Gel2 - Treatment 8 1 1 4 5 6 2 2 6 9 4 9 5 7 3 3 7 10 Parameters Smooth Saliency Min Area Auto Preview Detect Spots 9 60 4 Preview Cancel OK
4. Gel matching File Edit Tools View Reports Report Crop gels Detect spots Match gels 8 Gel1 - Control Gel2 - Treatment 8 1 1 4 5 6 2 2 6 9 4 9 5 7 3 3 7 10 Gel matching in progress…. Gel Matching Matching gels is complete! 9 matches have been created to 1 gel Gel Matching
5. Gel image overlaying File Edit Tools View Reports Gel1 - Control Gel2 - Treatment Control + Treatment
6. 3-D View of spots File Edit Tools View Reports Gel1 - Control Gel2 - Treatment
Part – II Results, Analysis and Interpretation
7. Spot analysis table File Edit Tools View Reports
8. Scatter plot for expression pattern of healthy Control vs diseased
Cluster Analysis Hierarchical Cluster(HCL) Analysis HCL Tree
Spot album Profile Spot Information Control Case Spot ID : X pI : 5.26 MW : 65.1kDal 3D view Control Case Fused Spot ID : Y pI : 5.28 MW : 44.8kDal 3D view Control Case Fused
Figure showing Molecular weight & pI pI index Molecular weight (kDal) Spot ID: X pI : 5.28 Mol. weight : 44.8 kDal Spot ID: Y pI : 5.26 Mol. weight : 65.2 kDal
Differential expression : Up regulation Up regulation x Folds or above No. of spots showing up regulation
Expression profile: Up regulation(2-2.5 folds up) -11 spots Mean normalized value of group 2 (P.falciparum diseased person) Ratio = Mean normalized value of group-Control(Healthy person)
Differential expression : Down regulation Down regulation x Folds or above No. of spots showing up regulation
Expression profile: Down regulation(9-10 folds down) - 9 spots Mean normalized value of group 2 (P.falciparum diseased person) Ratio = Mean normalized value of group-Control(Healthy person)
Conclusion • 2DE gel analysis using software helps to establish differential expression profile. • Gives the user information about up and down regulated protein spots. • Provides approximate pI and Molecular weight information. • The differential expressed spots may be further subjected to mass spectrometry to allow the further characterization.