Understanding Labor Demand: Equilibrium Analysis and Worker Hiring Decisions
This analysis explores labor demand through the lens of Marginal Revenue Product of Labor (MRPL) and Marginal Wage Cost (MWC). It addresses hiring decisions in various scenarios: determining the optimal number of workers to employ based on MRPL calculations, evaluating the added value of workers, and understanding how diminishing returns impact labor demand. Key insights reveal that firms must balance MRPL against MWC to maximize profits, ultimately leading to strategic hiring practices that ensure economic efficiency.

Understanding Labor Demand: Equilibrium Analysis and Worker Hiring Decisions
E N D
Presentation Transcript
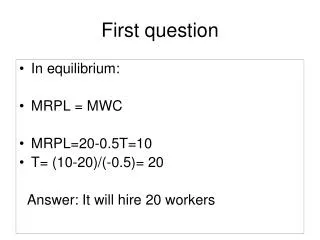
First question • In equilibrium: • MRPL = MWC • MRPL=20-0.5T=10 • T= (10-20)/(-0.5)= 20 Answer: It will hire 20 workers
Second question • 1. LDR starts with the 3rd worker, since its contribution is smaller than the previous worker for the first time • 2. The MPL of the 3rd worker is 5 • 3. The unit MRPL for pot 18th is the same as with the rest: 20! • 4. True The MRPL = MPL x unit MRPL (20) • 5. The firm will hire 4 workers (the 5th has a MRPL = 40, and 40 < 50 and the firm is losing money! 6 120 -
Third question • Answer: It will hire 3 overseers. If it hires more then MRPL = 350 < 500 = MWC
Fourth question • A) Third column (MPL) • B) Yes. Every additional cook contributes with a lower output than before • C) Sixth column
If the vertical axis represents equilibrium wages, then the red line is the firm’s demand for labor Euros 100 80 MRPL= Demand for labor 50 40 1 2 3 4 Workers A maximizing competitive firm will employ up to 2 cooks, producing 18 cakes; not more, because it will lose money since MRPL < MWC. Notice that the firm can get the highest profit with either 1 or 2 workers