Analyzing Spatio-Temporal Errors in Discharge Measurements from SWOT Observations
260 likes | 392 Vues
This study addresses the spatio-temporal errors in discharge measurements derived from SWOT satellite observations. It investigates two main questions: 1) the error associated with SWOT's temporal sampling and 2) the expected accuracy of discharge estimates from SWOT data. By analyzing in-situ measurements from 201 gauges worldwide, we estimate maximum errors based on river drainage areas, focusing on monthly discharge estimates. Furthermore, the study examines measurement errors related to river depth and evaluates their impact on discharge accuracy across different regions.

Analyzing Spatio-Temporal Errors in Discharge Measurements from SWOT Observations
E N D
Presentation Transcript
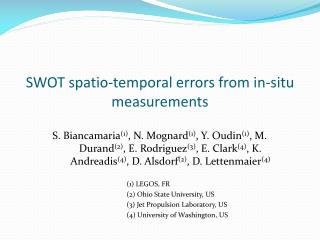
S. Biancamaria(1), N. Mognard(1), Y. Oudin(1), M. Durand(2), E. Rodriguez(3), E. Clark(4), K. Andreadis(4), D. Alsdorf(2), D. Lettenmaier(4) (1) LEGOS, FR (2) Ohio State University, US (3) Jet Propulsion Laboratory, US (4) University of Washington, US SWOT spatio-temporal errors from in-situ measurements
This study aims to address 2 questions: • What is the error due to the SWOT temporal sampling ? • How accurate can we expect discharge derived from SWOT measurements to be ? • Preliminary estimates of these errors are based on in-situ measurements at stream gauges. • Extend these errors from gauges to the whole rivers (for global estimates).
Purpose of the temporal sampling study • Estimate the maximum errors due to the orbit temporal sampling. • Hypothesis: SWOT measurements have already been converted to discharge. • Focus only on errors for monthly discharge estimates.
Methodology (1/2) • Step 1: Estimate the « true » discharge = daily discharge from in-situ gauges (Qt). • Step 2: From daily discharge, extract the discharge at SWOT observation time. 5-day and 10-day discharge have also been extracted. • Step 3: Compute the monthly mean from daily discharge (our « true » monthly mean, Qmt) and from the subsampled discharge (Qmsub).
Methodology (2/2) • Step 4: Compute the error (σt/Q): • Step 5: Compute this error for gauges around the world and classify them as a function of the river drainage area. • Step 6: Fit a relationship between the maximum error and the drainage area.
Gauges data used • 201 gauges used from USGS, GRDC, ANA and HyBAM:
SWOT orbit data used • Orbit 1: 20 day repeat period, 74° inclination and ~1000km altitude (3 day sub-cycle), • Orbit 2: 22 day repeat period, 78° inclination and ~1000km altitude. • Twodifferentorbits have been considered : Histogram of the SWOT observations for the 201 gaugesr
Error vs drainage area for the 201 gauges Maximum error fit (power law)
Error vs drainage area for the 201 gauges • Very similar errors between the 2 orbits. • Comparison with a constant sub-sampling: • 5 day subsampling = 4 observations in 20 days. • 10 day subsampling = 2 observations in 20 days. • SWOT errors closer to 10day subsampling errors. • Yet SWOT observation number in 20 days: from 2 (at the equator) to 7 and more (at high latitudes).
SWOT temporal sampling • Why SWOT errors not closer to 5 day subsampling errors ? • Because SWOT does not have a constant time sampling: SWOT sampling - Equatorial gauges SWOT sampling - Arctic gauges Time period not sampled Very close observations
Results summary • Using more than 200 gauges and 2 different SWOT orbits • A fit of the relationship between maximum errors and the drainage area has been computed. • Importance of the SWOT temporal sampling on the monthly discharge.
Purpose of this study • Rough estimate of the discharge error (using in-situ discharge) due to measurement error. • How the study could be extended to all the rivers. • Methodology (1/2) • Hypothesis: Power law relationship between discharge (Q) and river depth (D): Q=c.Db. • For river depth D=h-h0, h is the elevation measured by SWOT and h0 is the river bed elevation.
Methodology (2/2) • The error on the discharge estimates (σQ/Q) is: where σD is SWOT measurement error (σD=10cm)and η is the model error (between in-situ discharge and the discharge from rating curve).
Gauges data used • Gauges from USGS, ANA,HyBAM and IWM: 64 gauges in America 10 gauges in Bangladesh
Model error (η) vs SWOT measurement error • The SWOT measurement error is low. • Estimate the model error (η) is difficult: most of the discharges come from rating curve (very low error with good fit or high error because of bad fit). • Hypothesis: the model error ~20% (Dingman and Sharma, 1997; Bjerklie et al., 2003).
Sensitivity to the b coefficient • Power coefficient b in the power law rating curve depends on bathymetry, difficult to interpolate between gauges. • How is the discharge error sensitive to the b parameter ? with Q=c.Db
Sensitivity to the b coefficient • σQ/Q vs D and b (for η =0.2 and σD=10cm): 30% 1.5m with Q=c.Db
River Median(b) Amazon 2.0 Bangladeshi 3.2 Colorado 2.5 Mississippi 1.6 Missouri 3.8 All rivers 2.3 Sensitivity to the b coefficient • Median value and histogram of b for the 5 rivers: Coherent with previous studies: Fenton (2001) and Fenton and Keller (2001) found b=2; Chester (1986) found b=2.5.
Sensitivity to the b coefficient • σQ/Q computed for each gauge (η =0.2 and σD=10cm): Very low value of D (<80cm)
Results summary • Using more then 70 gauges with both discharge and water elevation. • The model error (η ) can be assumed ~20%. • Low influence of b on SWOT error for rivers with a depth above 1.5m (for a b coefficient below 3). • b=2 can be used to estimate SWOT measurement globally as it is close to the value found in this study and previous ones.
Conclusions • Importance of the SWOT temporal sampling on the computation of monthly discharge. • SWOT spatio-temporal errors have been computed from the in situ networks for different satellite orbits. • General hydrological parameters have been derived from these analysis. • These parameters will be used to generate discharge error maps for a global river network, (see the following talk from Kostas Andreadis).
Results • Tropical rivers (8°N<gauges latitude<20°N ) • Equatorial rivers (-13°N<gauges latitude<3°N ) • Mid-latitude rivers (33°N<gauges latitude<53°N ) • Arcticrivers (50°N<gauges latitude<72°N )