Download
1 / 36
360 likes | 377 Vues
Learn about the impact of El Niño and La Niña on Texas weather, their definitions, characteristics, and the ocean currents controlling these phenomena, with insights on weather patterns and satellite technology advancements.

E N D
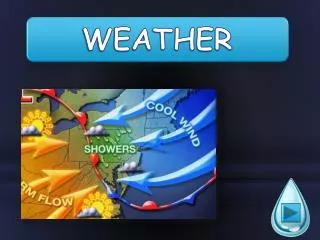
What weather phenomena has the largest impact on our weather in Texas?
El Niño and La Niña
Definitions: El Niño - Unusually warm surface water temperatures in the Pacific ocean caused by weak or reversed direction trade winds. La Niña - Unusually cold surface water temperatures in the Pacific ocean caused by strong easterly trade winds.
Shared Characteristics: El Niño and La Niña are • Pacific Ocean-Atmospheric systems • The most powerful phenomenon on earth • Alters more than half the planet’s climate
Strange phenomenon occur during an El Niño and La Niña like...
La Nina Weather Characteristics • Cooling of the water in the Pacific Ocean • LessSnowand rain on the west coast • Decreased Humidity • Unusually cold weather in Alaska • Unusually warm weather in the rest of the USA(add to your notes) • Drought in the southwest: often triggering forest fires • Higher than normal number of hurricanes in the Atlantic • Flooding in Australia
El Nino Weather Characteristics • Warming of water in the Pacific Ocean • RainandFloodingon the Pacific coast • Increased Humidity • Warm weather disrupts food chains of fish, birds and sea mammals • Increase of thunderstorms in the southern United States. • Fewer than normal number of hurricanes in the Atlantic • Occurs more often than La Nina
Increased number of Hurricanes (La Niña) Strong trade winds!
Causing devastating floods in Australia (2010-2011 La Niña) Australia has the opposite weather of Texas!!
Fish populations decline off the coast of S. America (El Niño) Fish do not like warm water! (El Nino = bad fishing)
More tornadoes through tornado alley? NO!!! Scientists have found no significant correlation between El Niño and La Niña weather patterns and increased tornadoes.
Movement of Ocean Water Surface Ocean Currents Currents that are controlled by the wind. ~¼ mile depth, 10%
Deep Ocean Currents Currents controlled by water density: temperature and salinity 90% of the ocean water moves in deep ocean currents
Upwelling Upwelling brings up cold, nutrient rich water from the bottom of the ocean. Fish like cold water! More food (La Nina = good fishing)
What causes the patterns? Wind and normal trade wind pattern. Normal trade wind speeds
What causes an El Niño? Weak trade winds and weak upwelling cause warm water off the coast of S. America WARM! Trade winds very weak or blow in opposite direction.
What causes a La Niña? Strong trade winds blow surface water towards east, creating colder surface temperatures off South American coast. COLD! STRONG trade wind speeds!
NOAA drifting buoys #1 Measure... temperature currents winds
NOAA drifting buoys #2 Observations of conditions in the tropical Pacific are considered essential for the prediction of short term (a few months to 1 year) climate variations. To provide necessary data, NOAA operates a network of buoys which measure temperature, currents and winds in the equatorial band. These buoys daily transmit data which are available to researchers and forecasters around the world in real time.
But What About the Rest of the Ocean outside of the Equatorial Band? Since oceans cover about 70% of the earth’s surface, our ships, buoys and other in situ (at the collection site) instruments can’t possible cover that much space. Thanks to advanced space technology, we can now use satellites to help us collect large amounts of ocean data.
Satellites Contain instruments to measure wind, waves, temperature of the sea surface, ocean color, ocean surface currents, and tides.
Satellites . Satellites have revolutionized the ocean sciences. They have advanced our knowledge about the weather and ocean processes more than any other tool. Oceanographers can use these satellite measurements for numerical modeling to predict what is happening in the deep ocean.
TOPEX/Poseidon TOPEX/Poseidon (T/P) was launched in 1992 and has since mapped the ocean's surface topography. T/P covers the entire planet every 10 days--an impossibility for a ship. Radar altimeters on (T/P) accurately measures the satellite's distance from the ocean's surface and tells us about the ocean's surface currents, winds, and wave heights. TOPEX/Poseidon data are used to predict the position of swift currents that appear to be connected with eddies. Eddies are spinning water currents--like giant whirlpools and are considered to be the "weather of the oceans." Knowing the locations of eddies can increase the safety of workers on oil production platforms and other ocean going vessels. It is helpful in ship routing, commercial fishing, sailing, hurricane prediction, studying ocean circulation, and climate forecasting. January of 2006 was the official end of the mission. .
REVIEW El Nino = The Boy = Warm = We like La Nina = The Girl = Cold = We don’t like
Videos • http://www.youtube.com/watch?v=SR5VPAqVQBw El Nino explanation video 3min • http://www.youtube.com/watch?v=jEAv-9TZktY La Nina explanation video 3.5min • http://www.youtube.com/watch?v=iWTucpsClLc Austin newscast in January talking about Australia flooding 2min • http://www.youtube.com/watch?v=l5x8dJ57xkk Texas weatherman predictions for this year from July 2010. about 3min • http://esminfo.prenhall.com/science/geoanimations/animations/26_NinoNina.html All three animations