Download
1 / 39
390 likes | 559 Vues
The Structure and Dynamics of Solitons and Bores in IHOP. Steven E. Koch NOAA Research - Forecast Systems Laboratory Collaborators: Mariusz Pagowski 1 , Cyrille Flamant 2 , James W. Wilson 3 , Frederic Fabry 4 , Wayne Feltz 5 , Geary Schwemmer 6 ,

E N D
The Structure and Dynamics of Solitons and Bores in IHOP Steven E. Koch NOAA Research - Forecast Systems Laboratory Collaborators: Mariusz Pagowski1, Cyrille Flamant2, James W. Wilson3, Frederic Fabry4, Wayne Feltz5, Geary Schwemmer6, Bart Geerts7, Belay Demoz6, Bruce Gentry6, Dave Whiteman6 1 CIRA / Colorado State University 2 Centre National de la Recherche Scientifique (CNRS), Paris, France 3 National Center for Atmospheric Research 4 Radar Observatory, McGill University 5 CIMSS / University of Wisconsin 6 NASA / Goddard Space Flight Center 7 Department of Atmospheric Sciences, University of Wyoming
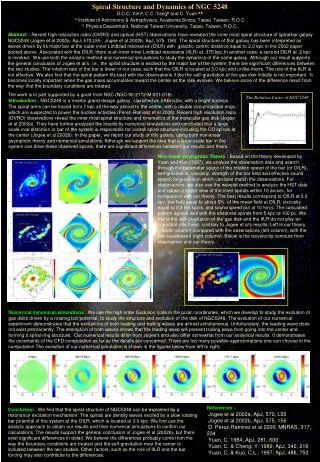
Gravity Currents in Geophysical Flows A gravity current is a horizontal mass flow driven by its greater density relative to its environment.
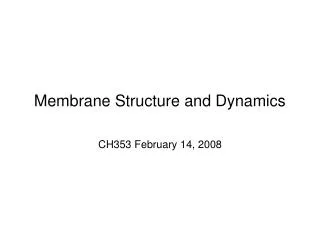
Evolution of a Gravity Current into a Bore An internal bore in the atmosphere is a kind of gravity wave generated by the intrusion of a gravity current into a low-level stable layer. Passage of the bore results in a sustained elevation of the stable layer. Unlike gravity currents, bores do not transport mass. Simpson (1987)
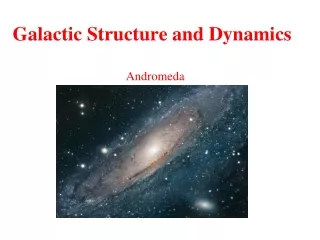
Evolution of Soliton from Bore A train of amplitude-ordered solitary waves (or soliton) can evolve from bores in some instances. Wave amplitudes vary inversely with their width and are highly dispersive. The number of waves increases with time, but is limited by turbulent dissipation. The energy of the wave system tends to be concentrated in the first few solitary waves.
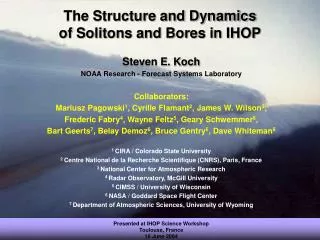
Types of Bores Transition of an undular bore into a turbulent bore depends upon its strength (db / h0). Bore strength is determined by the Froude Number and the ratio of the gravity current depth to the inversion depth (d0 / h0) Houghton and Kasahara (1968)
Theory(Rottman and Simpson 1989; Haase and Smith 1989) • Bore speed of propagation • Two parameters determine whether a bore will be generated from an intrusive gravity current: • m > 0.7 is required for bore • Solitary waves require large Froude Number • Vertical variation of the Scorer parameter determines likelihood of wave trapping
Complications • Gravity currents may generate other kinds of phenomena in addition to bores and solitons: • Kelvin-Helmholtz waves (strongly trapped waves that propagate rearward relative to the current head) • Trapped lee waves (display no tilt nor relative motion) • Intermediate structures during early stage of bore formation composed of some combination of current and inversion air • Bore properties may not compare well with theory when: • Vertical wind shear is present • The inversion is elevated or stratification is complex • Gravity current is unsteady or multiply-structured
IHOP_2002 (International H20 Project)Surface Observing Sites Homestead observing systems: • S-Pol Doppler radar with refractivity est. • FM-CW 10-cm radar @ 2-m resolution • MAPR (915 MHz Multiple Antenna Profiler @30-sec, 60-m resolution) • HARLIE (aerosol backscatter lidar) • GLOW (Doppler lidar) • Scanning Raman Lidar @ 2 min, 60m • AERI (Atmospheric Emitted Radiance Interferometer @10 min, 50m+) • CLASS (3-hourly soundings)
Pressure and Temperature Fluctuations Attending Passage of the Bores Warming or very slight temperature changes occur with passage of both bores
Evolution of gravity currents or bores (white lines) and synoptic cold front (blue line) as seen in Radar Composite and Mesonet Data A
Evolution of gravity currents or bores (white lines) and synoptic cold front (blue line) as seen in Radar Composite and Mesonet Data A
Evolution of gravity currents or bores (white lines) and synoptic cold front (blue line) as seen in Radar Composite and Mesonet Data B A
Evolution of gravity currents or bores (white lines) and synoptic cold front (blue line) as seen in Radar Composite and Mesonet Data B A
Evolution of gravity currents or bores (white lines) and synoptic cold front (blue line) as seen in Radar Composite and Mesonet Data B A
Evolution of gravity currents or bores (white lines) and synoptic cold front (blue line) as seen in Radar Composite and Mesonet Data B
Evolution of gravity currents or bores (white lines) and synoptic cold front (blue line) as seen in Radar Composite and Mesonet Data B
Evolution of gravity currents or bores (white lines) and synoptic cold front (blue line) as seen in Radar Composite and Mesonet Data B
Bore A FM-CW HARLIE
Bore A FM-CW MAPR
Bore B FM-CW UWKA Flight-Level Data Noisy data Raman Lidar
SE NW potential temperature Bore B seen in UW King Air Data at FL 1850 m AGL • 3C cooling and 4 g/kg more moisture are found at this level behind the bore (NW). • Amplitude-ordered solitary waves were penetrated by the UWKA at the top of the bore. • Vertical motions are in phase quadrature with q (upward motion leading cooling) and U (not shown), as in a typical gravity wave. vertical air velocity mixing ratio Wave propagation
A B AERI Detection of Bores A & B Potential Temperature Relative Humidity Mixing Ratio
Rapid decrease of refractivity in both S-POL and mesonet data due to drying caused by passage of bores (particularly bore A): entrainment?
Numerical Simulations of Turbulent Kinetic Energy (TKE) Generation and Mixing by Bore • Nested MM5 model (18, 6, 2, 0.666 km) initialized at 00Z 4 June 02 • Initial / boundary conditions from RUC-20 model • 44 vertical levels (22 below 1500 m) • Three PBL experiments (all use Mellor-Yamada 2.5 closures): • BT (Burk & Thompson 1989): uses diagnostic mixing length (shown) • ETA (Janjic 1994): similar to B-T scheme but with limit upon mixing length in statically stable layers resulting in less TKE generation • QL (Kantha & Clayson 1994) offers two advantages: • Richardson number-dependent shear instability mixing term in strongly stratified layers enhances TKE in stable layer above a well-mixed PBL • Prognostic equations for TKE and for mixing length To the movie
Gravity Current stage: 0036 UTCRadar fine line + cooling + pressure increase
Bore stage: 0233 UTCRadar fine lines + no cooling + pressure increase
Soliton stage: 0600 UTCTrain of wavelike radar fine lines + no cooling + pressure increase
Vertical structure of the bore as measured by Leandre2 DIAL water vapor system The evolution of the bore was observed by the LEANDRE 2 DIAL system on the P-3 aircraft alongN-S sections normal to the bore. S-POL provided PPI & RHI coverage Four P-3 overpasses occurred over the Homestead Profiling Site, offering comparisons with SRL, GLOW, and MAPR L2 WVMR retrievals: 800 m horizontal resolution 300 m vertical resolution
LEANDRE 2 : 3rd pass (0408-0427 UTC) Dry layer 17 km hB h0 • Amplitude ordered waves • Inversion surfaces lifted successfully higher by each passing wave • Trapping mechanism suggested by lack of tilt between the 2 inversion layers • Bore intensity (hB/h0) = 2.1
LEANDRE 2 : 4th pass (0555-0616 UTC) Dry layer 11 km 0.6 km • Waves are no longer amplitude ordered • Inversion surfaces lifted successfully higher by each passing wave • Leading wave is weaker, but clouds have formed aloft above each wave • Trapping mechanism suggested by lack of tilt between the 2 inversion layers
S-POL RHIs at 0530 UTC along azimuth 350° 11-km horizontal wavelength at 2.5-km level and 27 m s-1 LLJ seen in S-Pol data are consistent with Leandre-II and ISS observations, respectively
Representative Sounding for the Bore Environment seen in IHOP
Summary of Findings • Bores and solitons appeared as fine lines in S-POL reflectivity displays and their vertical structures were readily detected by remote sensing systems (DIAL, Raman lidar, HARLIE, GLOW, LEANDRE2, MAPR, etc). An unprecedented set of observations has been collected on the time-varying structure of bores and solitons in IHOP: 18 bore events were logged during the six-week IHOP experiment, allowing for common aspects of their environment to be determined! • Solitary waves developed to the rear of the leading fine line atop a 0.7-1.0 km deep surface stable layer. This layer increased in depth but weakened with passage of the leading wave. The inversion was then further lifted by each passing wave. • Nature of wave propagation does not suggest wave origin is intrinsic to bore dynamics as expected from bore theory, but rather, that “lee-wave” activity was the actual mechanism. • Solitary wave characteristics: • Horizontal wavelength = 10-20 km (4 June); 16 km decreasing to 11 km (20 June): why? • Phase speed = 7.3 – 20.3 m/s (4 June); 8 m/s decreasing to 5 m/s (20 June): why? • Waves exhibited amplitude-ordering (except in later stages of 20 June soliton) • Suggestion of wave trapping seen in Leandre, Raman Lidar data: really? • Pronounced reduction in refractivity occurred due to drying in the surface layer (June 4 only), but cooling & moistening seen aloft in both cases (AERI, UWKA data for Bore B on 4 June, Leandre on 20 June) was likely a result of adiabatic lifting.
Where do we go from here? • Attempt to synthesize MAPR and GLOW data to obtain 2D circulations in 20 June event, produce detailed Scorer parameter analyses for both events, and compare to moisture structures • Reexamine to what extent the observations are in agreement with the hydraulic and weakly nonlinear theories for gravity currents, bores, and solitons • Assess the trapping mechanisms allowing the bore to be maintained for such long distances (the Scorer parameter) and whether suggestions of wave trapping seen in Raman Lidar and Leandre-II data are correct interpretations • Understand the reason why the number of waves within the solitons varied with time and the mechanism for soliton breakdown • Determine whether waves seen in the remotely sensed data were truly dispersive solitary waves, or were instead lee waves, K-H waves, or some other wave phenomenon • Complete the numerical simulations to better understand these issues and also why drying (reduction of refractivity) only occurs sometimes. Bore forcing mechanisms are very sensitive to model physics, and details concerning entrainment and turbulence depend upon PBL parameterization – suggesting need for LES studies.