Rock Strength
Rock Strength. Maurice Dusseault. Common Symbols in RM. E, n : Young’s modulus, Poisson’s ratio f, r, g : Porosity, density, unit weight c ′ , f ′ ,T o : Cohesion, friction , tensile strength T, p, p o : Temperature, pressure, initial pres.


Rock Strength
E N D
Presentation Transcript
Rock Strength Maurice Dusseault
Common Symbols in RM • E, n: Young’s modulus, Poisson’s ratio • f, r, g : Porosity, density, unit weight • c′, f′,To: Cohesion, friction , tensile strength • T, p, po: Temperature, pressure, initial pres. • UCS: Unconfined Compressive Str. (σ′3 = 0) • sa,sr: Axial, radial stress (σ′ = eff. Stress) • τ, σ1-σ3: Shear stress, deviatoric stress • k: Permeability These are the most common symbols we use
Chalk Fracture Experiments… a. Three-point loading c. Pure axial tension 2P Surface of fracture Surface of fracture ? ? Compressive stress T T Tensile stress Fracture location indeterminate P P Fracture location directly under 2P P P b. Four-point loading d. Pure torsion (moment) Compressive stress Surface of fracture Surface of fracture is a helical shape M M Tensile stress Maximum tensile stress orientation Fracture location indeterminate, but between the two vertical loads P P
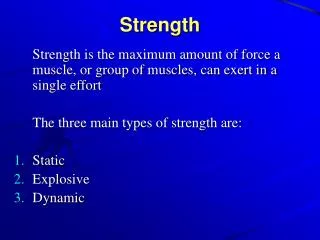
What is Strength? • It turns out that strength of a geomaterial is a highly complex subject… • There still remain issues on which the experts are not in full agreement (e.g. the scale dependency of tensile strength) • Strength can be a simple measure, such as unconfined compressive strength (UCS) • It can be complex (shear stress under a full 3-dimensional stress state, under temperature and elevated pore pressure conditions, etc.)
Yield Modes around a Borehole… HMAX High pw leads to slip of a joint or fault. Usually occurs only with high MW Brittle beam bucking under high uniaxial local loads Crushing in breakout apex Slip plane Destabilized column is “popping” out breakout HMAX Axial extension fractures: tensile failure when pw > • Plus some others… • Fissile shale sloughing if the borehole axis is close to parallel to fissility axis • Swelling, weakening, turning to “mush” • Borehole surface spalling from high , perhaps arising from heating, low ʹ High MW – Low MW Shear failure in low cohesion rock precedes sloughing of cavings
Rock Strength • Strength is the ability to sustain (support): • Shear stress (shear strength) • Compressive normal stress (crushing strength) • Tensile stress (tensile strength) • Bending (bending or beam strength) • All of these depend on effective stresses (s), thus, we must know the pore pressure (p or po) • Rock specimen strength is different than rock mass strength (joints, fissures, fissility…) • Tests are done on cores, chips, analogues…
Rock Mass vs Sample Strength Field scale: grains to kilometers. Lab scale: grains to 100 mm diameter specimen. slip planes a = 1 max planes Field stresses Z r r = 3 cores Triaxial Test Stresses a faults joints fractures grains bedding Scale differences and flaws mean that direct extrapolation of test results to the field is difficult in Petroleum Rock Mechanics Sample damage can change properties!
How We Measure Rock Strength… • Simple Measurements (no s3 – “index” tests) • Uniaxial Compressive Strength (UCS), s3 = 0 • Tensile strength (pure tension, hard for rocks!) • Indirect tensile test (Brazilian test) • Point-load, beam-bending, scratch test, needle… • Direct shear tests of a planar surface • A joint surface, bedding plane, fault plane, sheared plane, lithologic interface, etc. • The surface is loaded, then sheared, and the resistance to shear loads is recorded n rock slip plane
Beam Bending Tests Prepared specimen tests P/2 P/2 Beam-bending “tensile” test P/2 P/2 Core tests The “strength” of a rock in beam bending is strongly dependent on the specimen size and the “quality” of the surface finish! X-section
To Effect of Flaws on To P/2 P/2 Beam-bending tensile test P/2 P/2 Thus, To is flaw size dependent Surface finish A: notched B: rough C: polished A B C
Surface Finish and Flaws • If the strength of rock in beam-bending depends on the surface finish… • Beam-bending is of little value to engineering design issues • The strength of rock in tension is dependent on the size of the flaw • These observations, combined with the fact that rock masses have many discontinuities… • Suggest that tensile strength may be inappropriate for many rock engineering problems • Measurements of To are of questionable value
F Brazilian indirect tension test, common usage F Nevertheless… Tensile Strength… • Tensile strength (To) is extremely difficult to measure: it is direction-dependent, flaw-dependent, sample size-dependent, ... • An indirect method, the Brazilian disk test, is used • For a large reservoir, To may be assumed to be zero because of joints, bedding planes, etc. To = F/A F Prepared rock specimen Pure tension test: extremely rare A F
Other Index Tests of Strength • Index tests: strength “indices” only • Point load tests on core disks or chunks • Brinnell Hardness test, or penetration test • Scratch test on slabbed core sections • Sclerometer or steel bar rebound tests • All these use correla-tion charts for strength estimates L L jack round flat rock epoxy load scriber pull slab rebound measure mandril core Schmidt Hammer or Sclerometer
Recommendation • Include a strength index test program in all your core analyses • Service companies can provide this systematically upon request • The data bank can be linked to compaction potential, drillability, other factors… • It may help identify particularly troublesome zones that could cause troubles • Any systematically collected data will prove useful for correlations and engineering
Cautions! • However, index values are estimates only! • Scale is a problem! • What is the scale of interest to the problem? • Is testing a drill chip a test of sufficient scale? • Is it possible to index test fractured reservoirs? • Geometry is an issue! • How is strength affected by a 2 mm thick shale lamination in an otherwise intact sandstone? • Is strength anisotropic? • What is orientation w.r.t. the anisotropy?
Core #2 ~27500′ below sea level 8000 Scratch test results 7000 6000 5000 Correlation to UCS (psi) 4000 This core section is quite homogeneous throughout 3000 2000 ~ 1 foot (300 mm) length 1000 0 Red line is output from the load cell Blue line is an averaged value of the force
Core #1 ~28000′ below sea level Scratch test results Heterogeneous and damaged core Correlation to UCS (psi) ~ 1′ (300 mm) Red line is output from the load cell. Blue line is an averaged value of the force
Core #2 ~27500′ below sea level Scratch test results Heterogeneous, damaged core Correlation to UCS (psi) ~ 1 foot (300 mm) length
How We Measure Rock Strength… • Direct Measurements with confinement (s3) • Compressive Strength: Triaxial Testing Machine • Encase the core in an impermeable sleeve • Confining stress is applied s3 first • σa is then increased while… • Pore pressure constant • Record Δσa, εa, εr, ΔV • More exotic tests… • ΔT, Δp, even Δchemistry • Creep tests (constant σ, measure ) • Hollow cylinders… a = 1 slip planes max planes r r = 3 Triaxial Test Stresses a Strain rate
n slip plane rock Rock Strength- Shear Strength • Shear strength: a vital geomechanics measure, used for design • Shearing is associated with: n • Borehole instabilities, breakouts, failure • Reservoir shear and induced seismicity • Casing shear and well collapse • Reactivation of old faults, creation of new ones • Hydraulic fracture in soft, weak reservoirs • Loss of cohesion and sand production • Bit penetration, particularly PCD bits σ′3 σ′1 sn is normal effective stress t is the shear stress,║to slip plane
σ′a σ′r High Confining Pressure Frame Core Lab Inc. Frame Cell Press
p control, ΔVp σa thin porous stainless steel cap for drainage strain gauges εa, εr σr applied through oil pressure load platen seals impermeable membrane σa The Triaxial Cell CSIRO-Australia
Triaxial Test Apparatus • A confining stress s3 is applied (membrane) • The pore pressure is zero, or constant • The axial stress is increased slowly until well past peak strength • Deformation behavior is measured during test • T, po… can be varied in sophisticated systems Triaxial test cell. ( a ) Cell components including spherical seats A , end caps B , specimen C , fluid port D , Strain Gauges (optional), and polyurethane rubber sleeve F . ( b ) Insertion of E sleeve. ( c ) End cap removed to clean accumulated rock fragments. ( d ) Triaxial test with cell in position, showing four-column load frame, 200-t hydraulic jack load cell and pressure transducer connected to cell for automatic plotting of stress path. (Franklin and Hoek, 1970.) Sing06.049
f = 30% in situ, 35% in the core lab damage σ′a σ′r Shaley zone, sheared Oil sand, intact Some Issues in Testing • Sample disturbance • Sample homogeneity • Representativeness • Specimen preparation • Lateral e data? DV? • Δp response (shales)? • Testing must be done by a commercial lab with good QC • Even then, results are critically examined
´1 = ´a A σ′ ε Curve for a Rock Specimen σ1 - σ3 massive damage, shear plane develops ´3 = ´r Y - peak strength damage starts sudden stress drop (brittle) cohesion breaking stress difference continued damage ultimate or residual strength “elastic” part of σ′ε curve εa seating, microcrack closure axial strain
Shear Failure of Sandstone a = 1 • High quality cylinder • L = 2D • Flat ends • High angle shear plane • Zone of dilation and crushing r = 3 a
Yield and Strain-Weakening… • At one σ′3 value… • YP: peak shear strength • YR: residual strength • Red curve is at a high confining stress – s3 • Blue curve, low s3 • E.g.: high pore pressure = low s3, low strength, brittle behavior! • Low po… higher strength, ductile ’ – e behavior YP ductile yield YR strain-weakening Stress – sa - sr YP brittle rupture YR Axial strain - ea
Dilatancy During Rock Shearing • When rocks shear under low s3, they dilate (+V) • Dilation = +DV increase in pore V, microcracks • Rock is weakened, but with higher f, k values • For reservoirs and high p, s3 is low; dilation enhances permeability, an important factor in heavy oils… s’ – e behavior Y Stress – sa - sr Axial strain - ea +DV dilation = +ΔV Axial strain - ea -DV compression
40 30 ´3 = ´r 20 10 Full Triaxial Data Set Example ´1 = ´a ´3 = 14.0 MPa s-e curves a- r (MPa) ´3 = 7.0 MPa ´3 = 2.0 MPa UCS, ´3 = 0 Strain- % 0 +V Strain- % -V 1% Volume change measurement (dilation)
Rock Strength: the M-C Plot • To plot a yield criterion from triaxial tests, on equally scaled t, s axes, plot s1 and s3 at fail-ure, join with a semicircle, then the tangent = Y t • Y 4 triaxial tests are plotted here, plus the tensile strength from other tests cohesion c To sn s1 s3 Different s3 values
Triaxial s′-e Curves This is extremely complex, and partly “machine dependent”… s1 - s3 smax- peak strength massive damage, shear plane develops Y damage starts, ~0.60smax sudden stress drop (brittle or strain-weakening) cohesion breaking continued damage E stress difference Yr ultimate or residual strength “elastic” part ofs-ecurve specimen seating, microcrack closure axial strain -ea
Behavioral Model Representation Constitutive models: A: Linear elastic, no deviatoric dilation B: Perfect plasticity, no deviatoric dilation C: Instantaneously strain-weakening, post failure dilation angle D: Gradual weakening, post failure dilation E: General response, simulated with more complex models… A s-e curves B Deviatoric stress E D C E +ve DV (Deviatoric component) A B C, D -ve Strain (%)
Geomaterial Failure Modes -ve confinement (i.e. tension) Low confinement High confinement • Tensile rupture • Single plane • Minimal general • damage • Fracture • mechanics • Shear rupture • Bifurcation plane • Some general damage • Localization effects • Plasticity theory • with shearing • General damage • No bifurcation • Distributed • general damage • Continuum damage • mechanics best
Standard Approximation for Y Known as the Mohr-Coulomb (M-C) failure criterion t- shear stress Rocks are weak in tension!! real Y ′ cohesion Y = M-C Yield Criterion: f = c + n·tan for n≥ To f = 0 for n < To c′ Y - linear approximation To sn- normal stress
Use a Reasonable Y Approximation Mohr-Coulomb failure (or yield) criterion t- shear stress real Y standard approximation cohesion Rocks are weak in tension: assume To = 0? ′ c′ This is a better approximation for cases of low confining stress To sn- normal stress
Different Methods to Present Y • In the literature, there are > five different methods to plot rock yield (failure) criteria • The next slides show other examples of M-C yield criterion plots • I prefer the Standard Mohr plot… • Simple, clear, easy circle construction for s • There are also many yield criteria: Lade, Druker-Prager, Modified Von Mises… • I suggest: stick with the M-C criterion, it is robust, well understood, direct…
s1s3Plotting Method • Plot s1, s3 values at peak strength on axes • Fit a curve or a straight line to the data points • y-intercept is Co or UCS • (Note that circles to solve for stresses can only be used on a conventional M-C plot, not on this one!) s1 Curved or linear fit tan2a s1 - s3·tan2a - Co = 0 Uniaxial compressive strength, Co (not same as To) s3
p q Plotting Method • p = (s1 + s2)/2 • q = (s1 - s2)/2 • p is mean sn • q is shear stress • This method is most common in soil mechanics • Sometimes used in petroleum rock mechanics q actual curve a straight line assumption p q = Co/2 + p·tana
Why Approximations for Y? • Linear approximations of Y are easy to understand: cohesion plus friction effects • When yield (failure) criteria are plotted from real lab data, there is a lot of scatter • Numerical modeling is the only way to use the full curvilinear Y envelopes… • Thus, a linear approximation allows: • Quick calculations and estimates • A clearer picture of the physics • But! Use the right stress range to improve results of simple calculations
’ Still the Best (in my view)! Mohr-Coulomb yield criterion t - shear stress- σ1 – σ2 2 Y tf ′a = ′1 σ′n cohesion ′r = ′3 tf shear planes c’ sn- normal stress σ’3 σ’1 UCS To ~ 0.12·UCS σ′n
What is “Failure”? • Be very careful!! Failure is a loss of function. Rock yield is a loss of strength. • Don’t confuse them!! • For example: • Most boreholes have “yielded” zones • But, the hole has not collapsed! …or “failed”! • It still fulfills its function (allowing drill advance) sMAX smin Breakouts
Rock Strength – Sophisticated Tests Radial section • More sophisticated rock tests are also possible and useful in some circumstances: • Hollow cylinders, cavity tests • Creep tests for salt and soft shales • Thermal effects tests • Shale properties with different geochemistry • Drillability tests… etc. Axial section
Geomaterial Characteristics • Strain-weakening (peak strength & residual strength, YP, YR, are different) • failure strain, f = ƒ(3 ): f as 3 • YP, YR = ƒ(3 ): YP, YR as 3 • YP/YR = ƒ(3 ): YP/YR as 3 • Dilatancy • +V with increasing 1 - 3 • dilatancy suppressed as 3 • Thus we must link stresses, strains and failure behavior in our rock testing
List of Tests* from Core Lab Ltd.- A • Triaxial and uniaxial testing for E, ν, UCS • Sonic velocity testing for dynamic Young's Modulus and Poisson's Ratio (ED, νD) • Mohr-Coulomb envelope analysis and construction • Sonic velocity & acoustic impedance under σ′ • Sonic velocity in crude oils and brines • Seismic velocity testing at 10Hz • Hydrostatic and uniaxial pore volume compressibility • Calibration of sonic and dipole log *Downloaded list from their website
List of Tests from Core Lab Ltd. - B • Fracture azimuth and max stress azimuth (sonic velocity anisotropy) • Evaluation of natural fracture conductivity • Thick wall cylinder test (sand production onset) • Fracture toughness analysis • Brinell hardness test for closure stress analysis • Proppant embedment testing vs. closure stress • Brazilian indirect tensile strength • Point load tensile test for wellbore stability analysis www.corelab.com/PetroleumServices/Advanced/RockMech.asp
σa = σ1 σr = σ3 σr = σ3 σa = σ1 Strain and Shear Slip (Displacement) • As σa increased, εa took place as well • However, when yield took place, deformation only along slip plane! • We cannot speak about strain any more, only slip or deformation • Also, there is elastic strain and plastic strain…
Diagenesis and Strength slip planes a = 1 max planes diagenesis effects on the Mohr-Coulomb strength envelope shear stress r r = 3 chemical cementation Triaxial Test Stresses a densification (more interlock) original sediment cohesion diagenetic strength increase c normal stress s3 s1
Extreme Diagenesis Case… Xal overgrowths, interpenetrative structure!
Rock Strength – Shear Box Tests • Strength of joints or faults require shear box tests • Specimen must be available and aligned properly in a shear box • Different stress values (N) are used Area - A N - normal force S Shear box S - shear force N S A Linear “fit” Curvilinear “fit” data point N c A cohesion
Shearbox Apparatus • Normal load (stress) • Reaction frame with high stiffness • Split box for rock specimens to be tested • Different sizes can be mounted in the device • Shear displacement on lower half of “box” • Rails allow continuous “self-centering”