

SlideServe
Menu
Préférences
© SlideServe · v2026

Queuing Theory

damon avatar
25 diapositives · 1.3K Views · Jul 29, 2014

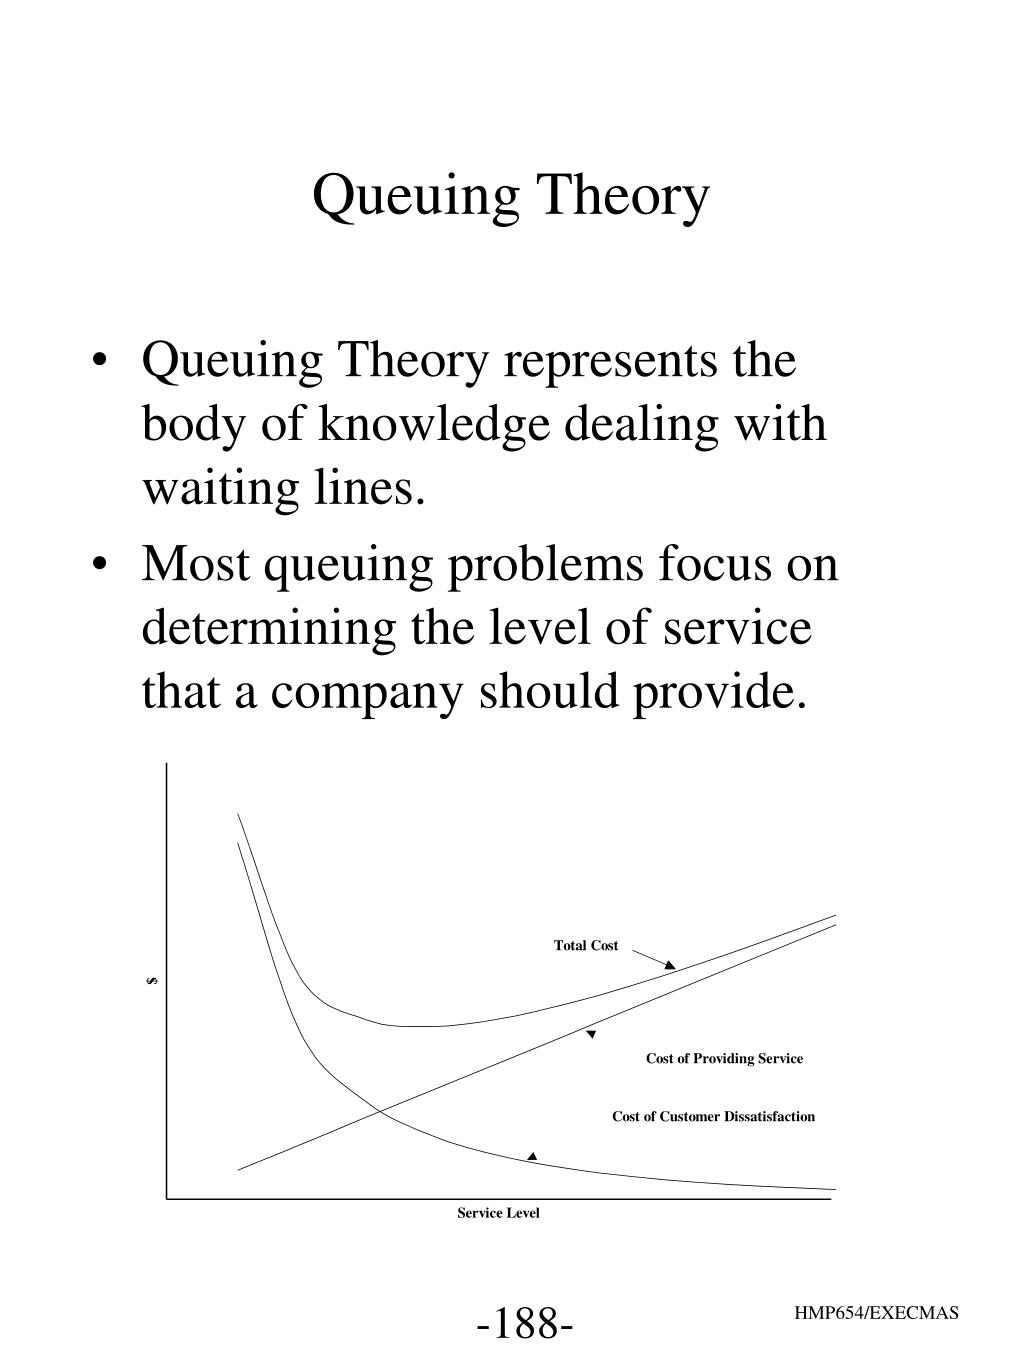
Queuing Theory. Queuing Theory represents the body of knowledge dealing with waiting lines. Most queuing problems focus on determining the level of service that a company should provide. Queuing Theory. Queuing Systems Configurations. Queuing Theory. Characteristics of a Queuing Process.
Queuing Theory - slide 1
01 / 25Queuing Theory
1 / 17

Télécharger la présentation

Queuing Theory
Une image / un lien ci-dessous est fourni (tel quel) pour télécharger la présentation

Politique de téléchargement : le contenu du site vous est fourni TEL QUEL pour votre information et votre usage personnel ; il ne peut être vendu, concédé sous licence ni partagé sur d’autres sites sans l’accord de son auteur.Le contenu vous est fourni TEL QUEL, pour votre information et votre usage personnel uniquement. Téléchargez la présentation en cliquant sur ce lien. Lors du téléchargement, si vous ne parvenez pas à télécharger une présentation, l’éditeur a peut-être supprimé le fichier de son serveur.Pendant le téléchargement, si vous ne parvenez pas à obtenir une présentation, le fichier a peut-être été supprimé par l’éditeur.

F I N

Plus de contenu associé

Transcription de la présentation
  1. Queuing Theory Queuing Theory represents the body of knowledge dealing with waiting lines. Most queuing problems focus on determining the level of service that a company should provide.

  2. Queuing Theory Queuing Systems Configurations

  3. Queuing Theory Characteristics of a Queuing Process • Generation of Customers • Infinite vs. Finite calling population • Homogeneity of the calling population • Individual vs. Batch arrivals • Deterministic vs. Stochastic arrivals • Queuing of Customers • Single vs. Multiple servers • Finite vs. Infinite queues

  4. Queuing Theory Characteristics of a Queuing Process • FIFO vs. LIFO disciplines • Priority rules • Servicing the Customers • Deterministic vs. Stochastic service time • Individual vs. Batch Processing

  5. Queuing Theory Characteristics of a Queuing Process • Generation of Customers • Poisson probability distribution ‘x’ represents the number of arrivals in a specific time period. ‘’ represents the ‘arrival rate’, that is, the average number of arrivals per time period.

  6. Queuing Theory Arrival Rate The time between arrivals is known as the interarrival time. If the number of arrivals in a given period follows a Poisson distribution, with mean , the interarrival times follow an exponential probability distribution with mean 1/ The exponential distribution exhibit the memoryless property. An arrival process is memoryless if the time until the next arrival occurs does not depend on how much time has elapsed since the last arrival.

  7. Queuing Theory Arrival Rate

  8. Queuing Theory Service Rate Queue time is the amount of time a customer spends waiting in line for service to begin. Service time is the amount of time a customer spends at a service facility once the actual performance of service begins. Service time is often model as an exponential random variable

  9. Queuing Theory Service Rate The service rate, denoted by , represents the average number of customers that can be served per time period. The average service time per customer is 1/ time periods.

  10. Queuing Theory Kendall Notation 1/2/3 • The first characteristic identifies the nature of the arrival process using the following standard abbreviations: M = Markovian interarrival times (following an exponential distribution) D = Deterministic interarrival times (not random)

  11. Queuing Theory Kendall Notation • The second characteristic identifies the nature of the service times using the following standard abbreviations: M = Markovian service times G = General service times (following a non-exponential distribution) D = Deterministic service times (not random) • The third characteristic indicates the number of servers available.

  12. Queuing Theory Operating Characteristics U - Utilization factor, or the percentage of time that all servers are busy. P0 - Probability that there are no units in the system. Lq- Average number of units in line waiting for service L - Average number of units in the system (in line and being served) Wq - Average time a unit spends in line waiting for service T - Actual time a unit spends in the queue W - Average time a unit spends in the system (in line and being served) Pw - Probability that an arriving unit has to wait for service Pn- Probability of n units in the system

  13. Queuing Theory The M/M/s Model • There are s servers in the system, where s is a positive integer • Arrivals follow a Poisson distribution and occur at an average rate of  per time period • Each server provides service at an average rate of  per time period, and actual service times follow an exponential distribution • Arrivals wait in a single FIFO queue and are serviced by the first available server •  < s

  14. Queuing Theory Formulas describing the M/M/s Model

  15. Queuing Theory Formulas describing the M/M/s Model

  16. Queuing Theory Q.xls

  17. Queuing Theory Case Problem (A) p. 140

  18. Queuing Theory Case Problem (cont.)

  19. Queuing Theory Case Problem (cont.)

  20. Queuing Theory Case Problem (cont.)

  21. Queuing Theory Case Problem (cont.)

  22. Queuing TheoryFinite Queue Model Case Problem (cont.)

  23. Queuing TheoryFinite Queue Model Case Problem (cont.)

  24. Queuing Theory Case Problem (cont.)

  25. Queuing Theory Case Problem (cont.)