Tree Structures (Hierarchical Information)
Tree Structures (Hierarchical Information). cs5764: Information Visualization Chris North. Where are we?. Multi-D 1D 2D Trees Graphs 3D Document collections. Design Principles Empirical Evaluation Visual Overviews. Trees (Hierarchies). What is a tree? DAG, one parent per node

Tree Structures (Hierarchical Information)
E N D
Presentation Transcript
Tree Structures(Hierarchical Information) cs5764: Information Visualization Chris North
Where are we? Multi-D 1D 2D Trees Graphs 3D Document collections Design Principles Empirical Evaluation Visual Overviews
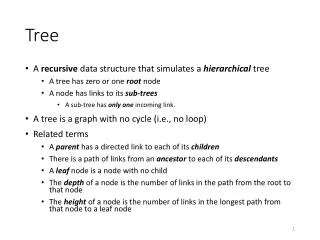
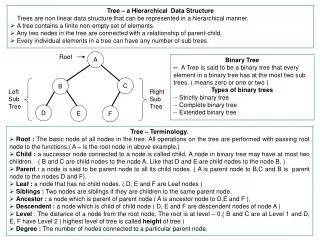
Trees (Hierarchies) • What is a tree? • DAG, one parent per node • Items + structure (nodes + associations) • In table model? • Add parent pointer attribute • 1:M
Examples • File system • menus • org charts • Family tree • classification/taxonomy • Table of contents • data structures • …
Tasks • Multi-D tasks, plus structure-based tasks: • Find descendants, ancestors, siblings, cousins • Overall structure, height, breadth, dense/sparse areas • …
Tree Properties • Structure vs. attributes • Attributes only (multi-dimensional viz) • Structure only (1 attribute, e.g. name) • Structure + attributes • Branching factor • Fixed level, categorical
Tree Visualization • Example: TreeView • Why is tree visualization hard? • Structure AND items • Structure harder, consumes more space • Data size grows very quickly (exponential) • #nodes = bheight
2 Approaches • Connection (node & link) • outliner • Containment (node in node) • Venn diagram A B C A B C
TreeView • Good for directed search tasks • subtree filtering (+/-) • Not good for learning structure • No attributes • Apx 50 items visible • Lose path to root for deep nodes • Scroll bar!
Mac Finder Branching factor: Small large
Hyperbolic Trees • Rao, “Hyperbolic Tree” • http://startree.inxight.com/ • Xerox PARC • Inxight • Focus+context
Cone Trees • Robertson, “ConeTrees” • Xerox PARC • 3D for focus+context
PDQ Trees • Overview+Detail of 2D tree layout • Dynamic Queries on each level for pruning
Disk Tree • Ed Chi, Xerox PARC • Overview:Reduced visual representation
WebTOC • Website map: TreeView + size attributes • http://www.cs.umd.edu/projects/hcil/webtoc/fhcil.html
FSN • SGI file system navigator • Jurassic Park • Zooming?
2 Approaches • Connection (node & link) • Outliner • Containment (node in node) • Venn diagram • Structure vs. attributes • Attributes only (multi-dimensional viz) • Structure only (1 attribute, e.g. name) • Structure + attributes A B C A B C
Treemaps • Shneiderman, “Treemaps” • http://www.cs.umd.edu/hcil/treemap3/ • Maryland • zooming
Treemap Algorithm • Calculate node sizes: • Recurse to children • node size = sum children sizes • Draw Treemap (node, space, direction) • Draw node rectangle in space • Alternate direction (slice or dice) • For each child: • Calculate childspace as % of node space using size and direction • Draw Treemap (child, child space, direction)
Squarified Treemaps • Wattenberg • Van Wijk
Cushion Treemaps • Van Wijk • http://www.win.tue.nl/sequoiaview/
Dynamic Query Treemaps • http://www.cs.umd.edu/hcil/treemap3/
Treemaps on the Web • Map of the Market: http://www.smartmoney.com/marketmap/ • People Map: http://www.truepeers.com/ • Coffee Map: http://www.peets.com/tast/11/coffee_selector.asp
DiskMapper • http://www.miclog.com/dmdesc.htm
Sunburst • Stasko, GaTech • Radial layout • Animated zooming
Sunburst (vs. Treemap) • + Faster learning time: like pie chart • + Details outward, instead of inward • + Focus+context instead of zooming • - Not space filling • - More space used by non-leaves • - Less scalability? • All leaves on 1-D space, perimeter • Treemap: 2-D space for leaves
CHEOPS • Beaudoin, “Cheops” • http://www.crim.ca/hci/cheops/index1.html • http://tecfa.unige.ch/~schneide/cheops/lite1.html
The Original Fisheye View • George Furnas, 1981 (pg 311) • Large information space • User controlled focus point • How to render items? • Normal View: just pick items nearby • Fisheye View: pick items based on degree of interest • Degree of Interest = function of distance from f and a priori importance • DOI(x) = -dist(x,f) + imp(x) f x
Example: Tree structure • Distance = # links between f and x • Importance = level of x in tree Distance: I A a i ii b i ii B a i ii b i ii Importance: I A a i ii b i ii B a i ii b i ii DOI: I A a i ii b i ii B a i ii b i ii f
Challenges • Multiple foci • George Robertson, Microsoft Research
Polyarchies • multiple inter-twined trees • Visual pivot • George Robertson, Microsoft Research
Nifty App of the Day • SAS JMP
Summary • Hyperbolic <1000 • TreeMap <3000, attributes, collective • Cheops = scale up