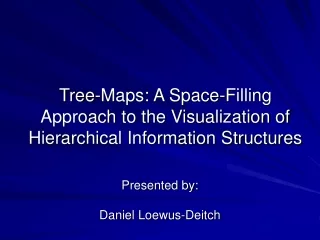
Tree-Maps: Visualizing Hierarchical Data
Tree-Maps: Visualizing Hierarchical Data. Hench Qian & Bill Shapiro September 21, 1999. Problem. Representing hierarchical data Structural information Content information Objectives Efficient Space Utilization Interactivity Comprehension Esthetics. Favorite Sentence.

Tree-Maps: Visualizing Hierarchical Data
E N D
Presentation Transcript
Tree-Maps: Visualizing Hierarchical Data Hench Qian & Bill Shapiro September 21, 1999
Problem • Representing hierarchical data • Structural information • Content information • Objectives • Efficient Space Utilization • Interactivity • Comprehension • Esthetics
Favorite Sentence • Most people come to understand the content and organization of these structures (hierarchical information) easily if they are small, but have great difficulty if the structures are large.
Traditional Methods • Outlines (e.g., Windows Explorer)
Traditional Methods • Tree Diagrams (WebView, University of Pittsburg) • Text-based tools (e.g., ls in UNIX)
An Alternative: Tree-Maps • Problems with traditional methods: • Lots of dead space • Difficult to represent large number of items • Tree-Maps • Utilize 100% of display space • Scalable to thousands of items
Critique • Strengths • Utilizes 100% of display space • Shows relationships between nodes through size and color • Can effectively display large data sets • Weaknesses • Size comparison may be difficult • Cluttered display • Difficult to discern boundaries • Shows only leaf content information
Other Hierarchical Visualization Tools • Docuverse (University of Pittsburg) • Containers (file directories) are shown as pie segments • Documents (files) are shown as colored dots within pie segments • Can represent a large number of items (~3000) • Utilizes a fraction of the display space
-shows 3502 files in 164 directories -pie segments represent # of links to each directory/file -Color represents age of files Docuverse
Other Hierarchical Visualization Tools • Hyperbolic Trees (Xerox/Inxight) • Dynamically warps display to zoom in on areas of interest • Good for interactive browsing • Does not provide a good overview of the entire dataset • Demo