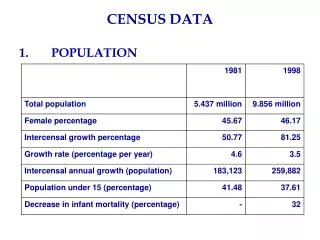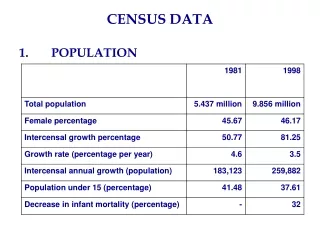
Census Data Visualization Methods and Techniques
Learn how to convey racial data and congressional redistricting using advanced PROC methods in SAS programming.


Census Data Visualization Methods and Techniques
E N D
Presentation Transcript
Visualizing Census Data Xanthippe Stevens and Larry Hoyle Policy Research Institute The University of Kansas
Conveying Racial Data with PROC GPLOT axis1 … axis2 order=(0 to &maxval. by &scale.) pattern1 color=white value=msolid; pattern2 color=blue value=msolid; proc gplot data=hilo; plot lo*v_year hi*v_year / overlay areas=2 haxis=axis1 vaxis=axis2; run; proc sql; select max(v_value), max(v_value)/4 into :maxval, :scale from race00; quit;
Congressional Redistricting Data with PROC GSLIDE if first.segment then do row=line; line=1; xsys = "2"; ysys = "2"; function="poly"; when= 'A'; style="msolid"; output; end; else do row=line; function = "polycont"; when= 'A'; xsys = "2"; ysys = "2"; line = 1; style="msolid"; output; end; run; data annoplace; length function color $8; set city (keep=x y line type tlid placer segment); by placer segment;
Congressional Redistricting Data with PROC GSLIDE data anno; /*concatenate annotated county and city data*/ set annocnty annoplace; run; goptions reset=all gunit=pct border device=gif gsfname=dist3map ftext=swissb htitle=6 htext=3; proc gslide annotate=anno; run; quit;
Congressional Redistricting Data with PROC GMAP proc gmap map=mapset data=dist3; id cousubr; choro popvar/levels=6 coutline=black; run;
Population Data with PROC GMAP data anno; length function style color$8; set city (keep=x y city value); xsys='2'; ysys='2'; hsys="1"; style='pempty'; position='5'; color='blue'; x=x; y=y; function='pie'; angle = 0; rotate= 360; valrange=&maxval-&minval; size=.5+(value/valrange)*5; line=0; when='A'; output; run;
Population Data with PROC GMAP goptions reset=global gunit=pct border cback=white device=gif570 gsfname=giffile ctext=black ftext=swiss htitle=6 htext=3; title1 'Kansas Cities, Population 2000'; footnote1 j=r 'Source: U.S. Census Bureau '; proc gmap map=countymap data=blanks; id county; choro cfill/discrete nolegend coutline=cxCCCCCC annotate=anno; run; quit;
Data with PROC GMAP and ACTIVEX goptions reset=global device=activex transparency; ods html body=”&varname..html” path=ODSOUT; proc gmap map=mapset data=ksdata; id fips; prism &varname./ discrete nolegend coutline=black; run; quit; ods html close; data mapset; set maps.uscounty; where state=20; length fips 8; fips=county+20000; run;
Drill-down Maps using PROC GMAP and JAVA ods listing close; ods html file="&geo..html" path=ODSOUT archive='http://www.ku.edu/pri/ ksdata/sashttp/java/mapapp.jar' parameters=("DRILLDOWNMODE"= "HTML") parameters=("DRILLPATTERN"= 'http://www.ku.edu/cgiwrap/ ippbrwww/city.pl?cityfips= {&txtplace}') parameters=("BACKCOLOR"= "FFFFFF");
Drill-down Maps using PROC GMAP and JAVA proc gmap map=temp data=temp; id idvar; choro txtplace/discrete nolegend coutline=black; run; ods html close; ods listing; quit;
Proportional Shading Using Data Step and PROC GMAP value shade __________________ 1 CXF1F1FF 4 CXEBEBFF 9 CXE0E0FF 16 CXD1D1FF 25 CXBEBEFF 36 CXA7A7FF 49 CX8C8CFF 64 CX6C6CFF 81 CX4848FF 100 CX2020FF
Proportional Shading Using Data Step and PROC GMAP goptions colors=( CXF1F1FF CXEBEBFF CXE0E0FF CXD1D1FF CXBEBEFF CXA7A7FF CX8C8CFF CX6C6CFF CX4848FF CX2020FF );
Proportional Shading Using Data Step and PROC GMAP <TABLE BORDER> <TR> <TD bgcolor="#CCCCFF" colspan=15 align="center">PRECIPITATION (INCHES) - 1998 <TR> <TD bgcolor="#6767FF"> <TD><font size=2> Allen </font> <TD align="char" char="."> <font size=2> 47.37</font> <TD bgcolor="#7D7DFF"> <TD><font size=2> Doniphan </font> <TD align="char" char="."> <font size=2> 41.69</font>
Proportional Shading Using Data Step and PROC GMAP /* print the cells */ put '<TD bgcolor="#' shade +(-1) '"> ' '<TD> <font size=2>' county cntyfmt. '</font>' '<TD align="char“ char="."> <font size=2>' value best7. '</font>';
Glyph Map using PROC GMAP %macro shades(var=, lablvar=, data=, loshade=0, hishade=255, midval=xmax/2-xmin/2);
Glyph Map using PROC GMAP Shade from red to yellow if &var < (&midval) then do; imval=int(.499999 + &loshade + (&var-xmin) * ( (&hishade-&loshade)/((&midval)-xmin) )); shade = 'CX' || 'FF' || put(imval, hex2.) || '00' ; end;
Glyph Map using PROC GMAP Shade from yellow to green else do; imval=int(.499999 + &loshade + (&var-(&midval)) * ( (&hishade-&loshade)/(xmax-(&midval)) )); shade = 'CX' || put(&hishade - imval + &loshade,hex2.)|| 'FF' ||'00'; end;
Data Step Graphics Interface /* FEMALES */ barxleft=&grwdth+ &leftmrg+ &cntrmrg; barxright=floor(&grwdth+ &leftmrg+ &cntrmrg+ barlenF); rc=gdraw('bar', barxleft, barybot, barxright, barytop);
Defining a new area xan@ku.edu AL9526952720002 ******
SAS code for the examples in this paper can be found at http://www.ku.edu/pri/ksdata/sashttp/mwsug01. Larry Hoyle larryhoyle@ku.edu (785) 864-9110 Xan Stevens xan@ku.edu (785) 864-9111 Policy Research Institute The University of Kansas 1541 Lilac Lane, Suite 607 Lawrence, Kansas 66044 http://www.ku.edu/pri