Download
1 / 8
80 likes | 209 Vues
This document illustrates the procedure for estimating the confidence interval for the proportion of customers who rate a new sandwich at least 6 on a 10-point scale. A fast food manager, having sampled 40 customers for the mean rating, aims to determine the proportion likely to repurchase based on positive ratings. By applying calculations related to the sample proportion and standard error, the manager can ascertain a confidence interval of 47.5% to 77.5% for customers who rate the sandwich favorably, highlighting the uncertainty in the estimates and the need for larger sample sizes.

E N D
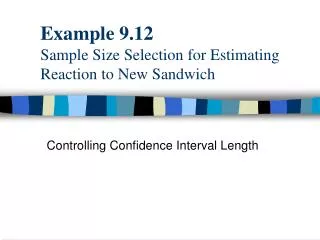
Example 9.4Estimating the Response to a New Sandwich Confidence Interval for a Proportion
Objective To illustrate the procedure for finding a confidence interval for the proportion of customers who rate the new sandwich at least 6 on a 10-point scale.
Background Information • The fast food manager from Example 9.2 has already sampled 40 customers to estimate the population mean rating of its new sandwich. • Recall that each rating is on a scale of 1 to 10, 10 being best. • The manager would now like to use the same sample to estimate the proportion of customer who rate the sandwich at least 6. • Her thinking is that these are the customers who are likely to purchase the sandwich again.
SANDWICH2.XLS • This file contains the solution. • To create this output, we first count the number of ratings that are at least 6 in cell E6. The easiest way to do this is with the formula =COUNTIF(B4:B43,”>=6”) • Then we calculate the sample proportion in cell E7 with the formula =E6/E3
Results -- continued • The rest is simply a matter of implementing the equations. Specifically, the standard error formula in cell E11 is =SQRT(E7*(1-E7)/E3)and the formula for the upper limit of the confidence interval, in cell E13 is =E7-E12*E11 • Of course, the formula for the upper limit of the confidence interval is the same except with a plus sign.
Results -- continued • Then using the confidence interval limits pL = 0.475 and pU=0.775, we can check the assumption of the large sample size. • With n=40, you can check that npL,n(1-pL), npU, and n(1-pU) are all well above 5, so that the validity of this confidence interval is established.
Conclusions • The output is fairly good news for the manager. • Based on this sample of size 40, she can be 95% confident that the percentage of all customers who would rate the sandwich 6 or higher is somewhere between 47.5% and 77.5%. • This is a large interval so there is a lot of uncertainty. To reduce this interval the manager would have to sample more customers.