Download
1 / 59
600 likes | 735 Vues
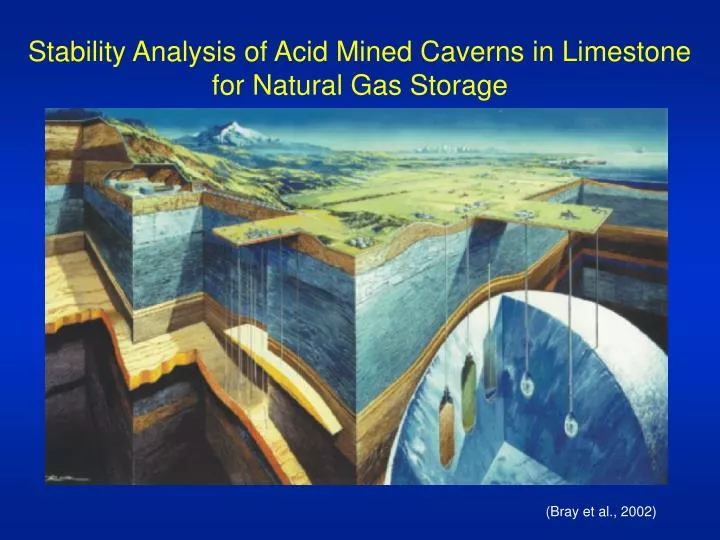
Stability Analysis of Acid Mined Caverns in Limestone for Natural Gas Storage. (Bray et al., 2002). Overview. Background Natural Gas Use and storage methods Objective Modeling Methods FLAC Code Parameters simulated Modeling Results Ideal cavern geometry Parameter variations

E N D
Stability Analysis of Acid Mined Caverns in Limestone for Natural Gas Storage (Bray et al., 2002)
Overview • Background • Natural Gas Use and storage methods • Objective • Modeling Methods • FLAC Code • Parameters simulated • Modeling Results • Ideal cavern geometry • Parameter variations • Conceptual model
Natural Gas Primarily Composed of Methane 23% of U.S. Energy Use Used by 60% of Households in U.S. Consumption Varies: There is a Seasonal Increase of Almost 50% During the Winter Storage Allows for Continuous Service During High Demand Natural Gas Use by Sector (AGA, 2005)
Underground Natural Gas Storage Depleted Reservoirs + Existing infrastructure - Location - 50% Cushion Gas Aquifers + Location - Up to 80% Cushion Gas - Highest Cost Salt Caverns + High injection and withdraw + Low Volume Cushion Gas - Limited Locations
Gas-Storage Caverns Created by Acid Dissolution Process Based on Solution Mined Salt Caverns Advantages + Carbonate Formations are Common Suitable Formations in Appalachian Basin Identified + Low Cushion Gas + Economically Competitive With Other Methods (Castle et al., 2004)
Salt Cavern Development by Water Injection (Barron, 1994)
Project Concept • Creation of 0.5 to 1.0 BCF Natural Gas storage caverns in carbonates by dissolution with Hydrochloric Acid. • Approximately same volume as Brackett Hall • Optimal depth range: 1220-2740 m (4000-9000 ft)
Objectives • Will the proposed gas storage facility be mechanically stable? • What is the optimal cavern shape? • How do parameters such as in-situ stress, cavern geometry and internal cavern pressure effect cavern stability?
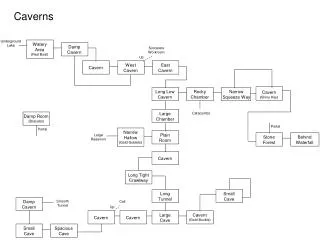
Basic Shapes Simulated *Not to scale*
20x50 m 10x200 m 10 m 50 m 20 m 200 m ‘Tunnel’ r = 10 m 40x12 m Spherical: r = 24.6 m Conical: r = 25 m h = 96 m Basic Shapes Simulated *Not to scale*
Simulation Approach Low Baseline High Gas Volume (STP) 0.25 BCF 0.5 BCF 1.0 BCF Cavern volume 31285 m3 62570 m3 125140 m3 Center Cavern Depth 1220 m 1830 m 2440 m Horizontal Stress 0.4 σv 0.8 σv 1.2 σv Cavern Radius 40 m 20 m 10 m Cavern Height 12 m 50 m 200 m
Mass of Gas Stored in Cavity r d M = Mass V = Volume ρavg = average gas density at depth A = cross sectional area = d = 0 at top of cavity and increases downward
Stability Simulations Run With FLAC 5.0 • Fast Lagrangian Analysis of Continua • Itasca Consulting Group, Inc. Minneapolis, MN • 2-D explicit finite-difference code for geomechanics • Commonly used in: Mining Engineering Civil Engineering
Simulation Approach • Develop mesh set up for each shape • Start at hydrostatic and increment P up then down • Evaluate stability at each pressure • Evaluate stresses and displacements at pressures of interest
○ * At Yield in Tension At Yield in Shear Plasticity Indicators - The shear and normal stresses lie on the Mohr-Coulomb failure envelope defined for the material - Stresses have reached the tensile strength of the material
Determining Pressure Limits • No Yield: Plasticity indicators were absent at the end of the calculation cycle • Less than 20 percent edge at yield: There was some yield indicated, but was < 20% percent of the perimeter • Greater than 20 percent edge at yield: Yield was indicated along > 20% of the cavern edge while cavern stability was maintained • Failure indicated: Unbalanced force and displacements indicated that failure has occurred. Large portions of the cavern are at yield
Unbalanced Force: Indicator of system stability System stable if ‘UF’ goes to zero
Unbalanced Force: Indicator of system stability System stable if ‘UF’ goes to zero Instability
Displacement as instability indicator: Pressure up to p* 1.5 then down to blowout Y displacement 10-2 m Steps
Displacement as instability indicator: Pressure up to p* 1.5 then down to blowout P* 1.5 Return to Hydrostatic Y displacement 10-2 m Create Cavern Steps
Displacement as instability indicator: Pressure up to p* 1.5 then down to blowout P* 1.5 Return to Hydrostatic Y displacement 10-2 m Create Cavern Slope on y displacement plot indicates instability Steps
Example: • 10 x 200 m Domed Cylindrical Cavern
Plasticity Indicators at Pstar 1.6 during pressurization: First Yield
Maximum Principal Stress at Pstar 1.6 during pressurization: First Yield
Plasticity Indicators at Pstar 2.6 during pressurization: > 20% at Yield
Plasticity Indicators at Pstar 3.0 during pressurization: Failure Indicated
Maximum Principle Stress at Pstar 3.0 during pressurization: Failure Indicated
Maximum Principle Stress at Pstar ≈ 0 during depressurization: No Yield indictated
Gas Volume at Standard State in 10 x 200 m Domed Cylindrical Cavern
Gas Volume at Standard State in 20 x 50 m Cylindrical Cavern, k = 0.8
In-Situ Stress Ratio and Stability • Stress Ratio Predicted Range ~ 0.4 -1.3 • Simulated k of 0.4, 0.6, 0.8, 1.0, 1.2 • Expected Range in Appalachian Basin 0.8-1.2
Failure indicated for all caverns during initial creation at k = 0.4
Failure indicated for all caverns during initial creation at k = 0.4
Failure indicated for all caverns during initial creation at k = 0.4
Stress Ratio 0.6 Stress Ratio 0.8
Stress Ratio 1.0 Stress Ratio 1.2
Failure indicated for 20 x 50 m cavern during initial creation at k = 1.2
Failure indicated for 20 x 50 m cavern during initial creation at k = 1.2
Failure indicated for 20 x 50 m cavern during initial creation at k = 1.2
Shape Summary • Failure indicated first along flat roofs and floors • Domed shapes would have greater stability • Taller narrow cylindrical caverns more stable than shorter wider caverns • Spherical cavern sable, but has higher percentage of yield along edge
Pressure Cycling • Slow vs. Quick pressure changes • Narrow vs. Broad pressure range
Slow Pressure Cycling from Pstar 1.0 to 1.5 in 20 x 50 m cylindrical cavern
Pressure Cycling from Pstar 1.0 to 1.3 in 10 x 200 m domed cylindrical cavern
Internal Pressure • Pressure cycling may lead to cavern failure • Slow pressure changes more stable than quick pressure changes • Narrow pressure range more stable than broad pressure range
Conceptual Model Of Cavern Failure • Low Horizontal: σh < σv • High Horizontal: σh > σv • One failure mechanism at High Internal Pressure • Several failure mechanisms at Low Internal Pressure
Low Horizontal Far Field Stress: Local Stress: High Horizontal Far Field Stress: Local Stress: