Efficient Inventory Planning and Control Systems for Operations Management
Learn about inventory planning and control systems in operations management to meet market demands efficiently. Explore single and multi-stage inventory systems, economic order quantity, lead time management, and inventory classifications. Enhance your understanding of key inventory terms and optimize your inventory processes.

Efficient Inventory Planning and Control Systems for Operations Management
E N D
Presentation Transcript
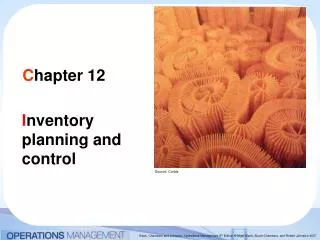
Chapter 12 Inventoryplanning and control Source: Corbis
Inventory planning and control Inventory planning and control Operations strategy The market requires …a quantity of products and services at a particular time Operations management Design Improvement The operation supplies ...the delivery of a quantity of products and services when required Planning and control
Rate of supply from input process Rate of demand from output process Inventory Input process Output process Inventory Inventory is created to compensate for the differences in timing between supply and demand Source: Alamy/Van Hilversum
Stock Sales operation Local distribution point Distribution Central depot Sales operation Suppliers Suppliers e.g. Automotive parts distributor e.g. Local retail store Single-stage and two-stage inventory systems Single-stage inventory system Two-stageinventory system
Input stock Stage 3 WIP Stage 2 WIP Stage 1 Finished goods stock e.g. Television manufacturer A multi-stage inventory system Suppliers
Garment manufacturers Cloth manufacturers Yarn producers Retail stores A multi-echelon inventory system Regional warehouses
A paper merchant must get its inventory planning and control right
Steady and predictable demand (D) Orderquantity = Q Slope = demand rate (D) Average inventory = Q 2 Q D Instantaneous deliveries at a rate of Inventory profiles chart the variation in inventory level Inventory level Time D Q per period
Plan A Q = 400 Average inventory for plan A = 200 Plan B Average inventory for plan B = 50 Q = 100 0.1 yr 0.4 yr Two alternative inventory plans with different order quantities (Q) Demand (D) = 1000 items per year 400 Inventory level 100 Time
Total costs Holding costs Order costs Economic order quantity (EOQ) Traditional view of inventory-related costs 400 350 300 250 200 Costs 150 100 50 100 300 50 200 400 250 150 350 Order quantity 400
Produce B Produce B Produce C Produce A Produce C Produce A Deliver A Deliver C Deliver A Deliver B Deliver C Deliver B Cycle inventory in a bakery Inventory level Time
Slope = P – D Slope = D M Q P Inventory profile for gradual replacement of inventory Source: Alamy/ArchivBerlin Fotoagentur GmbH Order quantity Q Inventory level Time
Shortages Inventory planning allowing for shortages Inventory level Time
Re-order level Re-order point Order lead time The re-order point Demand (D) = 100 items per week 400 300 Inventory level 200 100 0 0 1 2 3 4 5 6 7 8 Time
Re-order level (ROL) Distribution of lead-time usage d1 d2 t2 t1 Safety stock(s) helps to avoid stock-outs when demand and/or order lead times are uncertain Q Inventory level ? S Time
0.4 0.4 0.3 0.3 Probability Probability 0.2 0.2 0.1 0.1 0 0 5 4 110 140 3 130 2 120 1 Order lead time Demand rate 0.4 0.3 Probability 0.2 0.1 0 200-299 100-199 400-499 300-399 600-699 500-599 700-799 Lead-time usage The probability distributions for order lead time and demand rate combine to give the lead-time usage distribution
Qm Q1 Q2 Q3 t1 t2 t3 A periodic review approach to order timingwith probabilistic demand and lead time Inventory level T0 T1 T2 T3 Time tf tf tf
Class A items Class B items Class C items Source: Howard Smith Paper Group Pareto curve for stocked items 100 90 80 70 60 Percentage of value of items 50 40 30 20 10 90 80 100 70 30 10 40 50 60 20 Percentage of types of items
Class B items – the next 30% or so of medium-value items which account for around 10% of the total stock value Class A items – the 20% or so of high-value items which account for around 80% of the total stock value Class C items – the remaining 50% or so of low-value items which account for around the last 10% of the total stock value Inventory classifications and measures
Revised total costs Revised holding costs Original total costs Original holding costs Original order costs Revised order costs Original EOQ Revised EOQ If the true costs of stock holding are taken into account,and if the cost of ordering (or changeover) is reduced,the economic order quantity (EOQ) is much smaller Costs Order quantity
Two-bin system Three-bin system Bin 1 Bin 2 Bin 1 Bin 3 Bin 2 The ‘two-bin’ and ‘three-bin’ re-ordering systems Re-order level + safety inventory Safety inventory Items being used Re-order level inventory Items being used
Key Terms Test Inventory (also known as stock) The stored accumulation of transformed resources in a process; usually applies to material resources but may also be used for inventories of information; inventories of customers (or customers of customers) are usually called queues. Buffer inventory An inventory that compensates for unexpected fluctuations in supply and demand; can also be called a safety inventory. Cycle inventory Inventory that occurs when one stage in a process cannot supply all the items it produces simultaneously and so has to build up inventory of one item while it processes the others.
Key Terms Test De-coupling inventory The inventory that is used to allow work centres or processes to operate relatively independently. Anticipation inventory Inventory that is accumulated to cope with expected future demand or interruptions in supply. Pipeline inventory The inventory that exists because material cannot be transported instantaneously.
Key Terms Test Work-in-process (WIP) The number of units within a process waiting to be processed further (also called work-in-progress). Economic order quantity (EOQ) The quantity of items to order that supposedly minimizes the total cost of inventory management, derived from various formulae. Economic batch quantity (EBQ) The amount of items to be produced by a machine or process that supposedly minimizes the costs associated with production and inventory holding.
Key Terms Test Re-order point The point in time at which more items are ordered, usually calculated to ensure that inventory does not run out before the next batch of inventory arrives. Re-order level The level of inventory at which more items are ordered, usually calculated to ensure that inventory does not run out before the next batch of inventory arrives. Lead-time usage The amount of inventory that will be used between ordering replenishment and the inventory arriving, usually described by a probability distribution to account for uncertainty in demand and lead time.
Key Terms Test Continuous review An approach to managing inventory that makes inventory-related decisions when inventory reaches a particular level, as opposed to periodic review. Periodic review An approach to making inventory decisions that defines points in time for examining inventory levels and then makes decisions accordingly, as opposed to continuous review. Usage value A term used in inventory control to indicate the quantity of items used or sold multiplied by their value or price.
Key Terms Test Pareto law A general law found to operate in many situations that indicates that 20% of something causes 80% of something else, often used in inventory management (20% of products produce 80% of sales value) and improvement activities (20% of types of problems produce 80% of disruption). ABC inventory control An approach to inventory control that classes inventory by its usage value and varies the approach to managing it accordingly. Perpetual inventory principle A principle used in inventory control that inventory records should be automatically updated every time items are received or taken out of stock.