Download
1 / 22
220 likes | 325 Vues
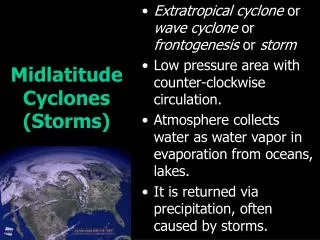
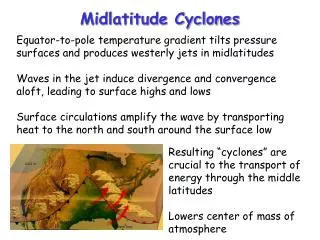
Learn about Midlatitude Cyclones through the life cycle stages, Bjerknes’ Polar Front Theory, factors influencing development, and vorticity's role. Explore the significance of flow aloft, divergence, and Rossby waves in storm initiation and evolution.

E N D
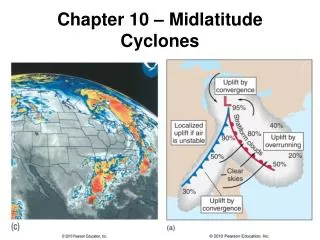
Lecture 21: Midlatitude Cyclones (Ch 10) 12Z now corresponds to 05:00 MST • Bjerknes’ Polar Front Theory of the life cycle of midlatitude cyclone (illustrated by storm in Ab over the weekend) • How the flow aloft factors into cyclone devlopment: vorticity and divergence, their connection with each other and with Rossby waves, and their relevance to storm initiation and development
Life cycle of mid-latitude cyclone: pre-cursor stage Fig. 10-1a • static front • wind “shear” • gravitational potential energy available • very “ordered”situation
Example of the pre-cursor stage (mountains complicate the scenario) • front clear at 850 • surface trough • opposing wind direction Fig. 10-1a
Life cycle of mid-latitude cyclone: kink develops on front Fig. 10-1b • Why? • Order - - - > disorder • wind shear • available potential energy converts to kinetic • (later came to be known that arrival of an upper trough can be the trigger)
Life cycle of mid-latitude cyclone: mature phase Fig. 10-1 • distinct cold & warm fronts • generally system moves towards the east (but often with N or S motion too) • idea that storms travel not clearly formulated until modern communications • may live for more than a week
Life cycle of mid-latitude cyclone: occluded (terminal) phase Fig. 10-1 • Low far from warm sector
(off CMC web site) (off NAVCAN web site) • storm formed (or deepened) overnight Saturday • (12 mb fall since 12Z Sat) • here still in “open wave” stage
freezing contour has been swung far to the south by the storm
With increasing knowledge of winds aloft, came recognition of role of mid- and upper troposphere in connection with storms… in particular, role of “vorticity” associated with the upper waves: • vorticity: rotation of an air parcel about a given axis (our interest: local vertical). Units [s-1] • has two components, which add to give the “absolute vorticity” • relative vorticitywR (rotation relative to axes fixed on earth; wR is positive for counterclockwise (ie. cyclonic) rotation in N. hemisphere) • earth vorticity ( = f , Coriolis parameter) depends only on latitude • “absolute vorticity”
Relative vorticity breaks into two contributions, shear term Sec. 10-1 Figs. 1 & 2 curvature term
Earth vorticity and relative vorticity Easy to visualize that a parcel at pole that is stationary w.r.t. earth has rotation in space Positive relative vorticity due to Negative relative vorticity due to Fig. 10-5 • on equator, no rotation about local vertical (f=0)
Rossby wave & vorticity Fig. 10-4 No relative vorticity North-south motion also changes the absolute vorticity as the earth component (f) changes…
Simplest paradigm for Rossby waves: = Sec. 10-1 Fig. 2
or or or Horizontal convergence & divergence • changes in vorticity matter in relation to storms because they “cause**” associated horizontal divergence/convergence that in turn associate with vertical motion and surface pressure changes • divergence is the same thing as negative convergence (just as decceleration is negative acceleration) • we can think of horizontal divergence (textbook symbol “ div ”) as “area-expansion in the horizontal plane” “cause**” in quotes, because unless this is analysed mathematically, there are chicken/egg ambiguities
Hozizontal divergence is a “differential property of the velocity field”… (t=t) (t=0) The plane of the paper is a constant height surface. At time t=0 the east-west component “u” increases towards the east, the north-south component “v” increases towards the north… This results in horizontal divergence (area expansion) The “shape” of the expanded area doesn’t matter… it is controlled by the velocity gradients
the cross-isobar wind in the friction layer causes low-level convergence (area shrinkage) and we have associated this with ascent (the air has “nowhere to go”) • now unless this accumulating air is pumped off the column somewhere higher in the troposphere, mass in the column • is increasing, which will weaken • the storm Fig. 10-2b • but clearly divergence (area-expansion) aloft would be the ticket to keeping the storm alive (or deepening it) • and it turns out that indeed the upper waves do cause a pattern of mid-tropospheric convergence and divergence
Changing relative vorticity as parcel moves through transition zones Fig. 10-6 (we’ll neglect changes in earth vorticity – valid if the wave amplitude is small)
Vorticity tendency & horiz. divergence aloft: “Vorticity Theorem” • rate of change of absolute vorticity following an air parcel is: (p286) • now ordinarily so • decreasing vorticity (l.h.s. negative) positive divergence aloft • happens in trough exit region • increasing vorticity (l.h.s. pos.) negative divergence convergence • happens in ridge exit region
Illustrates the ideal collaboration of upper wave & sfc storm • sfc convergence + upper divergence implies ascent… cloud + precip • sfc pressure trend result of a subtle imbalance • this pattern reliably valid for intense storms • topography complicates the pattern • Rossby waves not the only upper waves – short waves too Fig. 10-7
Vorticity of the mid-tropospheric flow so important meteorologists like to display it on upper winds analysis… Fig. 10-8
Analysed vorticity pattern at 500 mb is available on the web for 00Z, 12Z on CMC 00h prog … gives analysed 500 mb height + vorticity shading Darkest shading – largest (cyclonic) vorticity – trough axes Divergence aloft expected in south-central Ab… coincides roughly with area of storm that developed