Notes to Users
Customize this versatile template to present NSSE, BCSSE, or FSSE results effectively on your campus. Includes key sections for detailed audience-specific insights and a comprehensive overview of student engagement concepts and initiatives.

Notes to Users
E N D
Presentation Transcript
Notes to Users • This sample presentation is designed to serve as a customizable template to present NSSE, BCSSE, or FSSE results on your campus. The presentation is divided into the following topical sections to help you quickly select the slides most appropriate for a particular audience: • NSSE and the Concept of Student Engagement • NSSE 2010 & Selected [Institution] Results • BCSSE 2009, BCSSE 2009-NSSE 2010, and Selected [Institution] Results • FSSE 2010 & Selected [Institution] Results • What is the NSSE Institute? • Using Your NSSE-BCSSE-FSSE Data • Questions & Discussion • Contact Information • Replace the cover slide and the red text throughout this presentation with the name of your school and your own data. • Use slides from the “selected [Institution] results” sections for ideas on how topresent your campus results. • View the notes section of each slide for additional information or relevant talking points (in the PowerPoint tool bar select “view” then “notes page”)
Insert Presenter Name(s) Here Insert Presentation Date
Presentation Overview • NSSE and the Concept of Student Engagement • NSSE 2010 & Selected [Institution] Results • BCSSE 2009, BCSSE 2009-NSSE 2010, and Selected [Institution] Results • FSSE 2010 & Selected [Institution] Results • What is the NSSE Institute? • Using Your NSSE-BCSSE-FSSE Data • Questions & Discussion • Contact Information
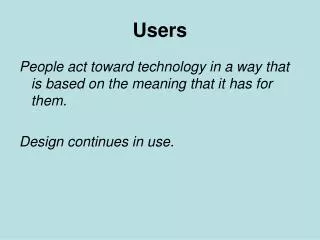
What is Student Engagement? • What students do -- time and energy devoted to studies and other educationally purposeful activities • What institutions do-- using resources and effective educational practices to induce students to do the right things • Educationally effective institutions channel student energy toward the right activities
Seven Principles of Good Practice in Undergraduate Education Student-faculty contact Active learning Prompt feedback Time on task High expectations Experiences with diversity Cooperation among students Chickering, A. W. & Gamson, Z. F. (1987). Seven principles for good practice in undergraduate education. AAHE: Bulletin, 39 (7), 3-7.
Other Supporting Literature After reviewing approximately 2,500 studies on college students from the 1990s, in addition to the more than 2,600 studies from 1970 to 1990, Ernest Pascarella and Patrick Terenzini concluded student engagement is a central component of student learning. Pascarella, E. & Terenzini, P (2005). How college affects students: A third decade of research. San Francisco: Jossey-Bass Publishers. Presents institutional policies, programs, and practices that promote student success. Provides practical guidance on implementation of effective institutional practice in a variety of contexts. Kuh, G. D., Kinzie, J., Schuh, J. H., Whitt, E.J., & Associates (2005). Student success in college: Creating conditions that matter. San Francisco: Jossey-Bass.
Launched with grant from The Pew Charitable Trusts in 1999, supported by institutional participation fees since 2002. More than 2,395,000 students from over 1,400 colleges and universities have participated to date. Institution types, sizes, and locations represented in NSSE are largely representative of U.S. baccalaureate institutions. NSSE Background
Goals of NSSE Project • Focus conversations on undergraduate quality • Enhance institutional practice and improvement initiatives • Foster comparative and consortium activity • Provide systematic national data on “good educational practices”
NSSE Survey Content Student Behaviors in College Student Learning & Development Institutional Actions And Requirements Student Reactions to College Student Background Information
NSSE Indicators ofEffective Educational Practice Active & Collaborative Learning Level of Academic Challenge Enriching Educational Experiences Student – Faculty Interaction Supportive Campus Environment
Survey Administration • Randomly sampled first-year & senior students (includes some census administrations) • Administration in spring term • Paper or Web-based • Multiple follow-ups to increase response rates • Consortia participation enables addition of custom questions
A Commitment to Data Quality NSSE’s Psychometric Portfolio serves as a framework for presenting evidence of validity, reliability, and other indicators of data quality. It is intended to serve higher education leaders, researchers, and professionals who use NSSE. See the Psychometric Portfolio nsse.iub.edu/links/psychometric_portfolio
Looking Ahead: “NSSE 2.0” Coming in 2013 • Building on a decade of student engagement research, a revised and updated survey instrument will launch in 2013. • “NSSE 2.0” will be pilot tested in 2011 & 2012. • Enhancements may include revisions to current questions, new survey content to complement existing items, and changes to one or more benchmarks. • Changes will be evaluated on their ability to improve and expand assessment of student engagement and to provide actionable results for institutional improvement. Plan your administration cycle now for the launch of NSSE 2.0 in 2013!
NSSE 2010 Respondents by Race, Ethnicity, and Nationality Totals may not sum to 100% due to rounding. NSSE 2010 population data are provided by participating institutions. U.S. percentages are unweighted and based on data from the 2009 IPEDS Institutional Characteristics and Enrollment File. IPEDS and NSSE categories for race and ethnicity differ. Percentages exclude students whose ethnicity was unknown or not provided.
NSSE 2010 Survey Population and Respondents • More than 1.2 million students were invited to participate in NSSE 2010, with 393,630 responding • x[Institution] students were invited to participate, with x responding
NSSE 2010 Institution Response Rates [Your institution’s]response rate = x% NSSE 2010 Institutional Response Rates All NSSE 2010 institutions = 37% Paper mode institutions = 33% Web-only institutions = 38% Web+ institutions = 35%
NSSE 2010 Results Sample Slides The following three slides are examples of how your institution might share selected NSSE results with various institutional constituencies. Expand this section to highlight items of interest to your audience.
Thinking about your overall experience at this institution, how would you rate the quality of relationships with faculty and administrative personnel and offices? NSSE 2010[Institution]Results
Thinking about your overall experience at this institution, to what extent does the college encourage contact between students from different economic, social, and racial or ethnic backgrounds? NSSE 2008 & NSSE 2010[Institution]Results
In thinking about your undergraduate program as a whole, including your major, have you done a culminating senior experience (e.g., senior comprehensive exam, capstone course, thesis or project)? Selected Peer Comparisonwith [Institution]Results
What percentage of our students (in comparison to selected peers) participate in community service or volunteer work? NSSE 2010 [Institution]Findings
What percentage of[Institution]students spent more than 5 hours per week participating in co-curricular activities? NSSE 2010 [Institution]Findings
BCSSE 2009, BCSSE 2009-NSSE 2010, & Selected [Institution] Results
BCSSE Purpose BCSSE measures entering first-year students’ pre-college academic and co-curricular experiences as well as their expectations and attitudes for participating in educationally purposeful activities during the first college year.
BCSSE Survey Content • There are 3 sections to the BCSSE survey • First section asks students about their high school experiences • Second section asks students about their expectations and beliefs regarding their first-year of college • The last section asks • students about background • characteristics.
Administration Modes • Paper, Web, or Mixed Modes • Paper group administration • Orientation, Welcome Week, etc. • Web group administration • While students are in computer lab, etc. • Web email administration • Web link emailed to students
Survey Content High School Experiences
Survey Content First-Year Expectations
Survey Content Many of these questions are designed to be matched with NSSE data. NSSE BCSSE
Survey Content BCSSE NSSE
BCSSE Reports • Four reports were provided: • BCSSE Report (Summer/Fall 2009) • BCSSE Advising Report (Summer/Fall 2009) • Grand Frequencies and Means (Fall 2009) • Overall • Institution types • BCSSE/NSSE Combined Report (Summer 2010)
During your last year of high school, about how many hours did you spend in a typical 7-day week doing each of the following? Preparing for class (studying, doing homework, rehearsing, etc.) BCSSE 2009 [Institution]Results
During the coming school year, how difficult do you expect the following to be? Learning course material BCSSE 2009 [Institution] Results
How often did you do or expect to do each of the following? Ask questions in class or contributed to class discussions. BCSSE 2009-NSSE 2010 [Institution] Results
NSSE Student-Faculty Interaction (SFI) by BCSSE Scale Academic Preparation BCSSE 2009-NSSE 2010 [Institution]Results NSSE Student-Faculty Interaction BCSSE Academic Preparation
Faculty Survey of Student Engagement College faculty survey that measures faculty members’ perceptions and expectations of students engagement in educational practices that are empirically linked with high level of learning and development (FSSE is pronounced “fessie”)
FSSE Survey Content • Faculty perceptions of how often their students engage in different activities • The importance faculty place on various areas of learning and development • The nature and frequency of interactions faculty have with students • How faculty members organize their time
FSSE 2010 Project Scope • In 2010, more than 19,000 faculty members from 154 institutions responded to the survey. • 71% of institutions used the course-based instrument; 29% used the typical student instrument. • The 2010 average institutional response rate was 48%.
FSSE Administration • Third-party administration • Institutions choose faculty to be surveyed • Faculty responses are kept anonymous • Faculty surveyed in the spring • Administered online as a Web-only survey • Survey options • Course-based questions • Typical student questions
Survey Option: Course-based • Each faculty member responds to questions about student engagement based on a course taught during the current academic year • Key Question: Please respond to the following questions based on one particular undergraduate course section you are teaching or have taught this academic year • Lower division (mostly first-year students and sophomores) • Upper division (mostly juniors and seniors)
Survey Option: Course-basedSample Question & Items • About what percent of students in your selected course section do the following?(None, 1-24%, 25-49%, 50-74%, 75% or higher) • Frequently ask questions in class or contribute to class discussions • Frequently come to class without completing readings or assignments • Receive prompt written or oral feedback from you on their academic performance • Have serious conversations in your course with students who are very different from them in terms of their religious beliefs, political opinions, or personal values
Survey Option: Typical Student • Each faculty member responds to questions about student engagement based on the typical first-year student or senior taught during the current academic year • Key Question: During the current academic year, have you had more first-year students or seniors in your classes?
Survey Option: Typical Student Sample Question & Items • About how often has the typical [first-year student, senior student] done each of the following? (Never, Sometimes, Often, Very often) • Asked questions in class or contributed to class discussions • Come to class without completing readings or assignments • Received prompt written or oral feedback from faculty on his or her academic performance • Had serious conversations with students of a different race or ethnicity than his or her own
Time Spent Preparing for Class Each Week by Discipline Course-Based Results
What percentage of [Institution] students spent more than 6 hours per week preparing for each of their classes? One-third (32%) of faculty expect students to spend greater than 6 hours preparing for each class in a week Less than one-tenth (8%) actually think that students spend this amount of time While slightly over one-tenth (12%) of full-time students actually spend this amount of time FSSE 2010 [Institution]Results