Attenuation Artifacts
A major teaching hospital of Harvard Medical School. Attenuation Artifacts. Thomas H. Hauser, MD, MMSc Director of Nuclear Cardiology Beth Israel Deaconess Medical Center Instructor in Medicine Harvard Medical School Boston, MA. Cases. Prone imaging Stress: 99m Tc-Sestamibi

Attenuation Artifacts
E N D
Presentation Transcript
A major teaching hospital of Harvard Medical School Attenuation Artifacts Thomas H. Hauser, MD, MMSc Director of Nuclear Cardiology Beth Israel Deaconess Medical Center Instructor in Medicine Harvard Medical School Boston, MA
Cases • Prone imaging • Stress: 99mTc-Sestamibi • Rest: 201Tl
Case 1 65 year-old man with a history of HTN who presented with chest pain. He was referred for an exercise stress test with nuclear imaging • He exercised for 6.5 minutes of a Bruce protocol • Peak HR 143 (92% predicted maximal) • Peak BP 194/64 • During exercise, he had chest pain but no ECG changes
Case 2 • 82 year-old woman with a history of CAD, s/p multi-vessel PCI, HTN, dyslipidemia who presented with chest pain. She was referred for dipyridamole stress with nuclear imaging. • Appropriate hemodynamic response with a fall in BP and an increase in HR. • She had no symptoms or ECG changes.
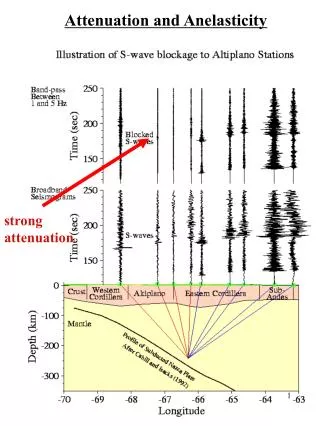
Challenge of Fixed Defects • Fixed defects can represent either myocardial infarction or an artifact due to soft tissue attenuation • Difficult to distinguish between them using standard filtered backprojection images alone • Soft tissue attenuation is very common • Major limitation in the specificity of SPECT imaging for the detection of CAD
Outline • Typical patterns of attenuation artifacts • Supine/Prone Imaging • Gated Imaging • Attenuation Correction
Outline • Typical patterns of attenuation artifacts • Supine/Prone Imaging • Gated Imaging • Attenuation Correction
Attenuation Artifact Patterns • Inferior (“Diaphragmatic”) Attenuation • Related to weight/abdominal girth • Inferior wall • Worse near the base • Anterior (Breast) Attenuation • Anterior wall • Usually sparing the apex • Arm Attenuation • Arms down imaging • Anteroseptal and inferolateral walls
Characteristics of Attenuation Artifacts • Tend to be of mild intensity, but can be moderate • Usually follow one of these typical patterns • Usually evidence of attenuation on the projection images or the attenuation map
Outline • Typical patterns of attenuation artifacts • Supine/Prone Imaging • Gated Imaging • Attenuation Correction
Positional Imaging • Supine Imaging • Inferior attenuation increased • Anterior attenuation decreased • Prone Imaging • Anterior attenuation increased • Inferior attenuation decreased
Supine/Prone Imaging • True perfusion defects are independent of position • Attenuation artifacts often change depending on patient position • If a defect appears or disappears with a change in position, then it is an artifact Segall et al. J Nucl Med 1989;30:1738-9.
Supine Prone Imaging • Pros • Cheap • Easy • Cons • Little data • Relatively poor performance
Outline • Typical patterns of attenuation artifacts • Supine/Prone Imaging • Gated Imaging • Attenuation Correction
Gated Imaging • Divides the cardiac cycle into phases • Data collected during each phase is pooled to form a single image • Images from each phase are put together to compose a series of images called a cine • Further information can then be obtained from this data by applying computer algorithms.
Gated Images • The number of gates depends on the desired temporal resolution and image quality • Always a trade-off between them • Finite number of counts • 8, 16, 32, 64 • Traditional vs. List mode • List mode not frequently used • Fixed vs. Variable RR interval
Gated Imaging • Although the display used at BIDMC shows four slices, the gated cine images are 3D. • Any set of slices can be selected • Many systems show the 3D images
Quantification • 3D images allow for accurate quantification of volumes in each phase of the cardiac cycle • Calculated by using computerized edge detection to determine the endocardial border • Usually displayed as a time-volume curve • LVEF = 1-(ESV/EDV)
Correlation of SPECT and MR EDV Ioannidis et al, J Am Coll Cardiol 2002;39:2059–68
Correlation of SPECT and MR EF Ioannidis et al, J Am Coll Cardiol 2002;39:2059–68
Differences between SPECT and MR EF Ioannidis et al, J Am Coll Cardiol 2002;39:2059–68
Image Quality • To get accurate quantification, the computer must be able to accurately detect the endocardium • Regular rhythm • Motion or other artifacts that significantly affect the perfusion images • Severe defects (real or attenuation) • No counts, no border • Small hearts
Arrhythmia • If the R wave occurs prior to the expected time • Later phases are empty for the prior beat • Timing of systole is different for next beat • If the R wave occurs after the expected time • Little effect on the prior beat • Timing of systole is different for the next beat • Either causes image blurring • To preserve image quality, RR intervals that deviate from the expected are rejected
Arrhythmia • Many software packages generate a histogram of RR intervals • Helpful to determine presence and severity of arrhythmia • If there is frequent arrhythmia rejection, then acquisition time can be overly prolonged • Use non-gated imaging with severe arrhythmia
Gated Imaging and Attenuation • Gated images provide functional data about regional systolic function • Translation • Wall thickening