Ice Attenuation
Ice Attenuation. RICE Meeting Sept. 18 th , 2004. John Paden. Pure Ice. Known Effects: Debye-relaxation due to vibrations of the polar molecules

Ice Attenuation
E N D
Presentation Transcript
Ice Attenuation RICE Meeting Sept. 18th, 2004 John Paden
Pure Ice • Known Effects: • Debye-relaxation due to vibrations of the polar molecules • Robert P. Auty and Robert H. Cole, “Dielectric properties of ice and solid D2O,” Journal of Chemical Physics, vol. 20:2, no. 8, pp. 1309-1314, August 1952. • Numerous absorption bands in the infrared region due to other resonances in the molecular and atomic structure of ice crystals. • Controversial: • Additional absorption bands between kHz and infrared regions. References in: • J. W. Glen and J. G. Paren, “The electrical properties of snow and ice,” Journal of Glaciology, vol. 15, no. 73, 1975. • Shuji Fujita , Takeshi Matsuoka, Toshihiro Ishida, Kenichi Matsuoka, and Shinji Mae, “A summary of the complex dielectric permittivity of ice in the megahertz range and its applications of radar sounding of polar ice sheets,” in Physics of Ice Core Records, T. Hondoh, Ed., Sapporo, Japan: Hokkaido University Press, 2000, pp. 185-212.
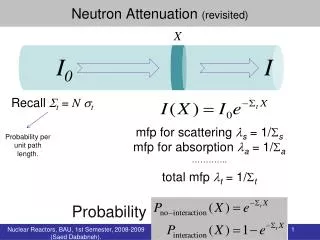
Debye-Relaxation • The Debye-relaxation equation: • P. Debye, Polar Molecules, Dover, New York, 1929. • The following parameters are all real. They are also functions of temperature and crystal orientation. • 0 is the static permittivity • is the high frequency limit of permittivity • is a time-constant related to the polar molecule’s resonance • Independent variables: • f is the frequency in Hz
Terms used in Debye-Model • Values of 0, , and can be found in: • Auty 1952 • Takeshi Matsuoka, Shuji Fujita, and Shinji Mae, “Effect of temperature on dielectric properties of ice in the range 5-39 GHz,” Journal of Applied Physics, vol. 80, no. 10, Nov. 15, 1996. • S. Evans, “Dielectric properties of iceand snow – a review,” Journal ofGlaciology, vol. 5, pp. 773-792, 1965.
Latest Measurements of • Christian Mätzler and Urs Wegmüller, “Dielectric properties of fresh-water ice at microwave frequencies,” Journal of Physics D: Applied Physics, vol. 20, pp. 1623-1630, 1987. • They propose the following linear fit (T is in Kelvin): • G. P. Johari and P.A. Charette, “The permittivity and attenuation in polycrystalline and single-crystal ice Ih at 35 and 60 MHz,” Journal of Glaciology, vol. 14, no. 71, pp. 293-303, 1975. • Ice Ih crystal refers to hexagonal structure which has uniaxial symmetry. This is the only form of ice crystals found in ice sheets. • Discusses temperature dependence of
Latest Measurements of • G. P. Johari, “The dielectric properties of H2O and D2O ice Ih at MHz frequencies,” The Journal of Chemical Physics, vol. 64, no. 10, pp. 3998-4005, May 15, 1976. • Discusses temperature dependence of • Matsuoka 1996 • Discusses frequency and temperature dependence of • Fujita 2000 • Discusses frequency, temperature, and crystal orientation dependence of • More references listed in Fujita 2000…
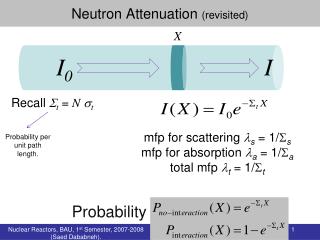
Debye: Absorption of Pure Ice • Absorption is essentially independent of frequency in the HF, VHF and UHF bands.
Infrared Absorption • Evans 1965 proposed infrared absorption bands effect microwave absorption. • Infrared absorption discussed in: • Stephen G. Warren, “Optical constants of ice from the ultraviolet to the microwave,” Applied Optics, vol. 23, no. 8, pp. 1206-1223, Apr. 15 1984. • Matzler 1987 proposes the form: • Where A, B, and C are temperature dependent empirical constants. • First term is from Debye relaxation, Second term is from Infrared absorption spectrum
Absorption of Pure Ice • Absorption becomes frequency dependent above 500 MHz.
Impurities (Acids and Salt) • Impurity levels are typically found using one of the following methods: • DEP (high frequency limit conductivity measured at LF) • Responds to acid and salt impurities as well as pure ice losses • Fujita et al. 2000 suggests that LF measurements are good into the microwave region. • ECM (near-DC conductivity) • Responds primarily to acid and therefore do not represent the full values of the conductivity. • ECM measurements have to be converted from current into [H+] concentration. Then from [H+] concentration into conductivity.
Conductivity • ECM: Fujita suggests 3.3 molar conductivity (that is 3.3 S/m for every mole of [H+] in a liter of ice) • Both ECM and DEP conductivities can be scaled to other temperatures according to an Arrenhius relationship: • Where E is the activation energy (0.22 eV is suggested value), R = 8.3144 J per mole per Kelvin is the universal gas constant, Tref is the temperature in Kelvin that the conductivity was measured, T is the desired temperature, and sigma-infinity is the reference conductivity.
Polarization • Birefrigence of ice reported in: • Shuji Fujita, Shinji Mae, Takeshi Matsuoka, “Dielectric anisotropy in ice Ih at 9.7 GHz,” Annals of Glaciology, vol. 17, pp. 276-280, 1993. • Takeshi Matsuoka, Shuji Fujita, Shigenori Morishima, and Shinji Mae, “Precise measurement of dielectric anisotropy in ice Ih at 39 GHz,” Journal of Applied Physics, vol. 81, no. 5, March 1, 1997. • S. Kawada, “Dielectric anisotropy in ice Ih,” Journal of Physics Society Japan, vol. 44, no. 6, pp. 1881-1886, 1978. • Examples: • George R. Jiracek, Radio Sounding of Antarctic Ice, Research Report Series 67-1, Nov. 1967. • Reported strong depolarization at south pole and other locations. • V. V. Bogorodsky, C. R. Bentley, and P. E. Gudmandsen, Radioglaciology, Dordrecht, Holland: D. Reidel Publishing Company, 1985. • References a number of examples.
Polarization • Fujita 2000.
Density • Up to this point, solid ice was assumed (density of solid ice is 0.9169 g/cm3) • Dry snow contains ice and air. • Determine permittivity using: • Mixing formula • Empirical models
Density • Papers: • Q. Robin, S. Evans, and J. Bailey, “Interpretation of radio echo sounding in polar ice sheets,” Philosophical Transactions of the Royal Society of London. Series A, Mathematical and Physical Sciences, vol. 265, no. 1166, pp. 437-505, Dec. 18, 1969. • Gives an empirical formula for real-part: • In the paper: Usually quoted: • Martti E. Tiuri, Ari H. Sihvola, Ebbe G. Nyfors, and Martti T. Hallikaiken, “The complex dielectric constant of snow at microwave frequencies,” IEEE Journal of Oceanic Engineering, vol. OE-9, no. 5, pp. 377-382, Dec. 1984. • Gives an empirical formula for both real and imaginary parts: • Real part: Imaginary part:
Density • Papers Con’t: • Austin Kovacs, Anthony J. Gow, and Rexford M. Morey, “The in-situ dielectric constant of polar firn revisited,” Cold Regions Science and Technology, vol. 23, pp. 245-256, 1995. • Gives good overview of various mixing formulas and suggests the following empirical model: • Glen and Paren 1975. • Gives equation for the real and imaginary parts using Looyenga’s mixing formula. • Real part: Imaginary part:
Bubble-Shape • While elongated bubbles with preferred orientation have been found… it is questionable how large their effect really is. • Reference: • S. F. Ackley and T. E. Keliher, “Ice sheet internal radio-echo reflections and associated physical property changes with depth,” vol. 84, no. B10, Journal of Geophysical Research, pp. 5675-5680, Sept. 10, 1979. • References: L. K. H. van Beek, “Dielectric behavior of heterogeneous systems,” Progress in Dielectrics, vol. 7, pp. 69-114, 1967.
Volume Scattering • Robin et al. showed this effect is negligible below 1 GHz. • Evans et al. confirmed Robin’s results • Vant et al. gives formula for prolate spheroids. These equations also show volume scattering is negligible below 1 GHz.
Typical Results for Loss • NGRIP (warm base) and GRIP (cold base)
Online Resources • http://www.ngdc.noaa.gov/paleo/icecore.html • http://www.nicl-smo.sr.unh.edu/icecores.html • http://www-nsidc.colorado.edu/data/search/search.html