Download
1 / 27
270 likes | 386 Vues
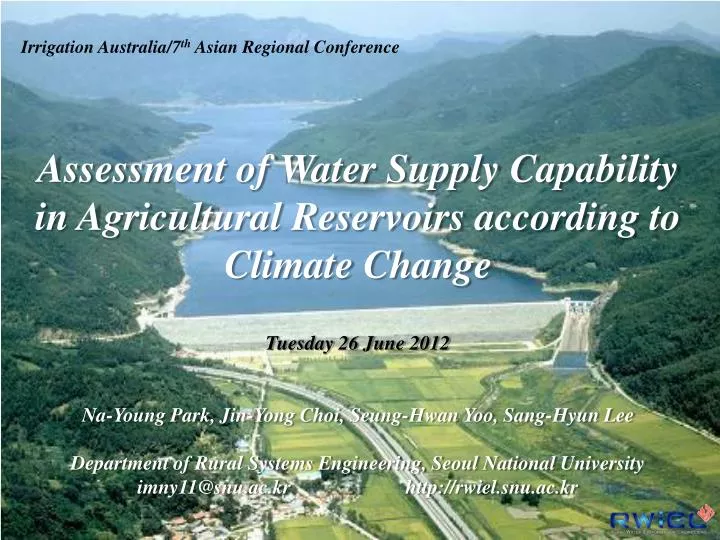
Irrigation Australia/7 th Asian Regional Conference. Assessment of Water Supply Capability in Agricultural Reservoirs according to Climate Change . Tuesday 26 June 2012 Na-Young Park, Jin-Yong Choi, Seung -Hwan Yoo , Sang-Hyun Lee

E N D
Irrigation Australia/7th Asian Regional Conference Assessment of Water Supply Capability in Agricultural Reservoirs according to Climate Change Tuesday 26 June 2012 Na-Young Park, Jin-Yong Choi, Seung-Hwan Yoo, Sang-Hyun Lee Department of Rural Systems Engineering, Seoul National University imny11@snu.ac.kr http://rwiel.snu.ac.kr
Contents 1. Introduction 2. Methodology 3. Results and Discussion 4. Conclusions
Irrigation in South Korea • 10% of land area is paddy fields and about 80% of the paddy fields are irrigated in South Korea. • Reservoirs supply about 60% of paddy fields as the main water resources, and others including pumping stations and headworks supply about 40%. Paddy field (National Statistical Office, 2010)
Agricultural reservoirs in South Korea • South Korea’s agricultural reservoirs • Scattered in the nation, aged facilities, various size <Year of reservoirs construction> <Irrigated area about drought return-period>
Climate change and agricultural reservoirs • Agricultural reservoirs have two different operations for irrigation and non-irrigation season • During irrigation season Supplying stable agricultural water • During non-irrigation season Storing water for irrigation • Climate change impacts on irrigation requirement • Temperature rising increases evapotranspiration Possibly increasing irrigation requirement • Increasingrainfall Opportunity for decreasing irrigation requirement • Altering seasonal rainfall amount and intensity Increasing or decreasing effective rainfall → Impacts on water supply capability of agricultural reservoirs (Ahnet al., 2002), (KMA, 2009)
Objectives • To analyze the irrigation water supply capability of agricultural reservoirs - about 10-year design drought return period - for RCP (Representative Concentration Pathways) scenarios - using reservoir water-balance model
Flow chart (2.6, 8.5)
Study area • Case 1: 3~7 year drought return period • Case 2: 10-year drought return period • Selected 16 reservoirs in 8 provinces
Climate change data • Emission scenarios • RCP (Representative Concentration Pathways) : 2.6 and 8.5 • GCM (General Circulation Model) • CanESM(The second generation Canadian Earth System Model) in CMIP5(Coupled Model Intercomparison Project Phase 5) • Downscaling • CF (Change Factor) : Statistical downscaling • Study period : • Historical (1976-2005) • 2025s (2011-2040), 2055s (2041-2070), 2085s (2071-2100)
Reservoir Water balance • Water balance model • t: time • S: Reservoir storage • I: Inflow (using tank model) • P: Precipitation on reservoir surface • R: Release (using FAO Modified Penman) • O: Overflow • E: Evaporation on reservoir surface Surface precipitation Surface evaporation Inflow Spillway overflow △ storage Effective storage Ground water inflow seepage Release Dead storage Subsurface infiltration
Projection of temperature • Trend of temperature at Suwon weather station (Gyeonggi-province: Central region of Korean Peninsula) • Increasing trends during all periods compared to historical records except RCP2.6_2085s <RCP 8.5> <RCP 2.6>
Projection of rainfall • Trend of rainfall at Suwon weather station • Increasing trends during all periods compared to historical records • RCP8.5_2085s showed largest increase of rainfall (295mm) <RCP 8.5> <RCP 2.6>
Regional comparison • Occurrence the dead storage
Analysis of water supply capability (1) • Reservoir A (case 1) : RCP2.6 scenario <Historical> Average <2025s> 10th percentile Transplanting period <2055s> <2085s>
Analysis of water supply capability (2) • Reservoir A (case 1) : RCP8.5 scenario <Historical> Average <2025s> 10th percentile Transplanting period <2055s> <2085s>
Analysis of water supply capability (3) • Reservoir B (case 2) : RCP2.6scenario <Historical> Average <2025s> 10th percentile Transplanting period <2055s> <2085s>
Analysis of water supply capability (4) • Reservoir B (case 2) : RCP8.5 scenario <Historical> Average <2025s> <Historical> 10th percentile Transplanting period <2055s> <2085s>
Conclusions • This study analyzed the water supply capability of agricultural reservoirs about 10-year design drought return period for RCP scenarios • Climate change causes • Increasing rainfall amount and temperature • Altering agricultural reservoirs water balance • Demonstrating that rainfall variation in May-June possibly causes irrigation shortage after transplanting period, especially for RCP 2.6_2025s and RCP 8.5_2085s • Future study • Analysis about the reservoir size and demand area and return periods in detail
Irrigation Australia/7th Asian Regional Conference Thank you!
Climate change data • RCP (Representative Concentration Pathways) • Greenhouse gas concentrations were determined by radiation that human activity effected on the atmosphere (IPCC AR5) • ‘representative’: one of several different scenarios that have similar radiative forcing and emissions characteristics • ‘pathways’: time-dependent projections of atmospheric greenhouse gas (GHG) concentrations
Climate data • CanESM2(The second generation Canadian Earth System Model) • Fourth version of CCCma(Canadian Center for Climate Modeling and Analysis) • To the IPCC AR4 Under consideration in CMIP5(Coupled Model Intercomparison Project Phase 5) • Study period : Historical (1976-2005) 2025s (2011-2040) 2055s (2041-2070) 2085s (2071-2100) (Arora et al, 2011)
Tank model • Tank model • Typical conceptual rainfall-runoff model • Simulate daily inflow in each reservoir for a data scarce watershed - First Tank : Concept of Surface flow - Second Tank : Concept of Inter flow - Third Tank : Concept of Base flow • Factors • Watershed area • Area of each land use type in watershed
Analysis of water supply capability (1) • Reservoir A (case 1) : RCP8.5 scenario <Historical> <2025s> 10th percentile <2085s> <2055s>