Download

1 / 24
240 likes | 255 Vues
Factor Analysis, HAR-RV Regressions, and F-Tests. Zed Lamba 4/9/08. ECON 201FS. Recap from Monday. Established through Factor Analysis that Realized Variation amongst 10 tech stocks in S&P 100 had high communality. Average Uniqueness was only 0.2374, when analysis was done on ln(RV)

E N D
Factor Analysis, HAR-RV Regressions, and F-Tests Zed Lamba 4/9/08
ECON 201FS Recap from Monday • Established through Factor Analysis that Realized Variation amongst 10 tech stocks in S&P 100 had high communality. • Average Uniqueness was only 0.2374, when analysis was done on ln(RV) • Question to be settled: how does introducing the market into the mix affect things? Can we establish whether the communality results from an industry effect or a market effect?
ECON 201FS S&P 500 Log Levels 04/97 – 10/07 • Critical to note scale on Y-axis
ECON 201FS Factor Analysis on ln(RV) • As before, there is 1 significant common factor • Goes against expectation that introducing the market would result in 2 common factors
ECON 201FS Factor Analysis contd. • Average Uniqueness (ignoring S&P): 0.2356 (slightly lower than before) • Average Uniqueness (including S&P): 0.2678
ECON 201FS Factor Analysis Analysis • S&P 500 Realized Variation (Uniqueness = 0.5893) essentially not well-explained by common factor (0.6 is considered threshold) • Possible explanations: • Communality amongst stocks results from industry effect • S&P 500 contains numerous tech stocks that have not been examined here, so results are biased
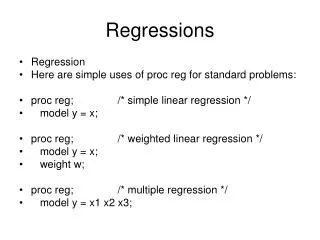
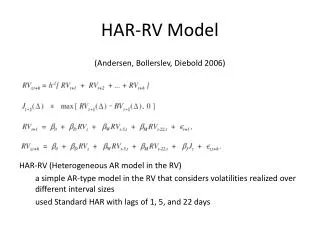
ECON 201FS HAR-RV Regressions • MSFT RV regressed against all stocks (including MSFT) and S&P • All regressors are lagged by 1 day, 5-day lag average, and 22-day lag average • Regressors’ Explanatory Power (Adjusted R2) = 0.6546 (was 0.6542 without S&P)
ECON 201FS Testing 1-day lags
ECON 201FS Testing 5-day average lags
ECON 201FS Testing 22-day average lags
ECON 201FS Testing CSCO • All 3 lags (1-day, 5-day average, and 22-day average) tested • F-Statistic = 4.03 • P-Value = 0.0072 • Conclusion: Mildly significant
ECON 201FS Testing DELL • All 3 lags (1-day, 5-day average, and 22-day average) tested • F-Statistic = 13.56 • P-Value = 0.0000 • Conclusion: Strongly significant
ECON 201FS Testing EMC • All 3 lags (1-day, 5-day average, and 22-day average) tested • F-Statistic = 0.13 • P-Value = 0.9394 • Conclusion: Completely insignificant
ECON 201FS Testing HPQ • All 3 lags (1-day, 5-day average, and 22-day average) tested • F-Statistic = 0.86 • P-Value = 0.4636 • Conclusion: Completely insignificant; surprising given DELL result. Perhaps Compaq merger can explain some unrelated RV?
ECON 201FS Testing IBM • All 3 lags (1-day, 5-day average, and 22-day average) tested • F-Statistic = 1.05 • P-Value = 0.3681 • Conclusion: Insignificant, goes with EMC result
ECON 201FS Testing INTC • All 3 lags (1-day, 5-day average, and 22-day average) tested • F-Statistic = 7.63 • P-Value = 0.0000 • Conclusion: Strongly significant
ECON 201FS Testing MSFT • All 3 lags (1-day, 5-day average, and 22-day average) tested • F-Statistic = 13.1 • P-Value = 0.0000 • Conclusion: Very strongly significant, as expected
ECON 201FS Testing ORCL • All 3 lags (1-day, 5-day average, and 22-day average) tested • F-Statistic = 2.34 • P-Value = 0.0714 • Conclusion: Almost significant, not quite
ECON 201FS Testing TXN • All 3 lags (1-day, 5-day average, and 22-day average) tested • F-Statistic = 0.15 • P-Value = 0.9267 • Conclusion: Completely insignificant
ECON 201FS Testing XRX • All 3 lags (1-day, 5-day average, and 22-day average) tested • F-Statistic = 1.95 • P-Value = 0.1194 • Conclusion: Insignificant
ECON 201FS Testing S&P 500 • All 3 lags (1-day, 5-day average, and 22-day average) tested • F-Statistic = 1.90 • P-Value = 0.1274 • Conclusion: Insignificant (recall Possible Explanations from Factor Analysis section)
ECON 201FS Regressing against Significant Stocks • Originally, 33 regressors combined for R2 of 0.6546 • 12 regressors here have combined R2 of 0.6489 • Thus, 12 regressors account for 99.13% of R2 • Should have reduced this to 9 regressors by removing 22-day average lags
ECON 201FS Extensions for Final Presentation • Check S&P 500 handling • Now that long-term industry trends have been established, see where GOOG fits in • Extract common factor indicated in Factor Analysis and use as regressor, as per Prof. Bollerslev’s suggestion