Download

1 / 81
830 likes | 1.03k Vues
Epidemiology of Diving Accidents and Deaths. 2006 Report (2004 Data). Medical Services Volume. 120. 40. Dives. 35. 100. DCS. 30. DCS/10,000 dives. 80. 25. 60. 20. 15. 40. 10. 20. 5. 0. 0. 95. 96. 97. 98. 99. 00. 01. 02. 03. 04.

E N D
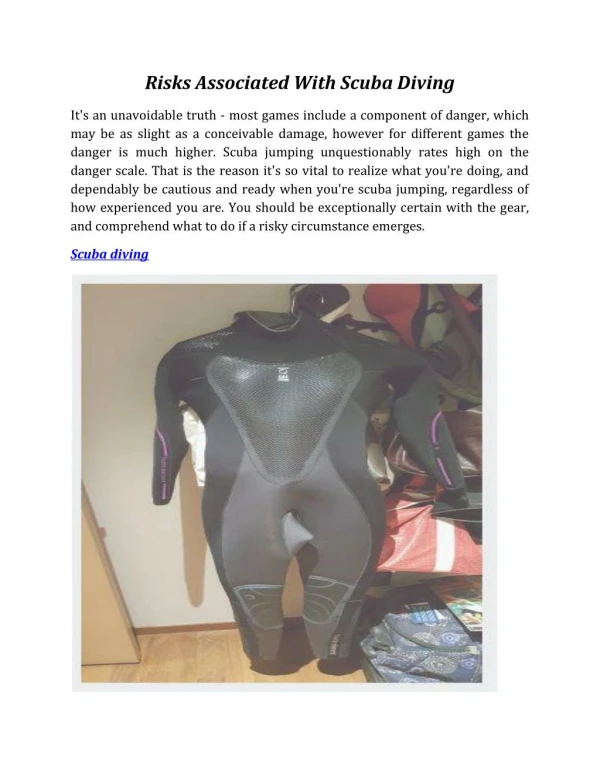
Epidemiology of Diving Accidents and Deaths 2006 Report (2004 Data)
120 40 Dives 35 100 DCS 30 DCS/10,000 dives 80 25 60 20 15 40 10 20 5 0 0 95 96 97 98 99 00 01 02 03 04 Cumulative Project Dive Exploration Progress DCS Thousands
Annual Record of Dive Injuries Number of Cases Year
Annual Record of U.S. & Canadian Diving Fatalities Number of Fatalities Year
Annual Record of U.S. & Canadian Breath-hold Diving Injuries Number of Cases Year
Annual DCS Incidence Rates/10,000 Dives at Scapa Flow and in the Caribbean Among Divers Enrolled in PDE DCS Per 10,000 Dives
Annual DCS Incidence Rates/10,000 Divers at Scapa Flow and in the Caribbean Among Divers Enrolled in Project Dive Exploration DCS Per 10,000 Divers
Annual Diving Death Incidence Rates/ 100,000 Divers for DAN and BSAC Members Fatalities per 100,000 Members
Cumulative Number of PDE Dives Collected from 1995-2004 N = 105,135 Dive Exposures (Thousands) Year
Age and Gender of Divers N = 1,521 Percentage of Divers Age Group (Years)
Age Distribution of Pre-teen and Teenage Divers N = 65 Frequency Age (Years)
Percentage of 2004 PDE Volunteers by Certification of Divers and Gender Percent of Divers N = 1,521
Percentage of PDE Volunteers by Number of Years Since Certification
Chronic Health Conditions Reported by PDE Volunteers N = 1,521 Percent of PDE Divers
Acute Health Problems Before Diving Reported by PDE Divers N = 1,521 Percent of PDE Divers
Percentage of the PDE Sample by Dive Platform N = 23,947 Percentage of PDE Dives
Subjective Thermal Comfort N = 23,947 Percentage of PDE Dives
Percentage of PDE Sample Reporting the Indicated Subjective Workload N = 23,912 Percentage of PDE Dives
Single, Repetitive and Multi-day Dives N = 3,265 Percentage of Dive Series
Number of Days in Dive Series N = 3,265 Percentage of Dive Series Days Diving
Number of Dives in Dive Series N = 3,265 Percentage of Dive Series Number of Dives
Maximum Depths of PDE Dives 16,512 Dives by Males 7,395 Dives by Females Percentage of Dives Depth (fsw)
Depth of Deepest and Last Dive in PDE Dive Series (N = 3,265) Percent of Dive Series Depth (fsw)
Dive Depth by Day Sequence in Dive Series N = 23,907 Mean Depth (fsw) Dive Day Sequence
Distribution of Dive Depths Among PDE Subgroups Percent of Dives Depth (fsw)
Number of Dives by Dive Planning Method N = 23,912 Percentage of Dives
Percentage of PDE Divers Reporting Altitude Exposure After Diving N = 3,265 Percentage of Dive Series Type of Altitude Exposure After Diving
PDE Dives With Reported Procedural Problems Percentage of Dives
International Source of Injury Reports for 2004 Percent of Injury Reports
Percentage of Cases by Reported Diagnoses N = 487 Source of Injury Reports (%)
Confidence in DCS and AGE Diagnoses Diagnostic Confidence (Percent of Group)
Diver Age Groups Frequency of Age Group Median Age of Group (Years)
Certification Level Percent of Injured Divers
Maximum Depth (fsw) of the Last Dive Before Injury by Gender
Number of Symptoms Per Diver N = 264 Number of Reported Symptoms Number of Symptomatic Divers
Percent of Reports by Individual Symptom N = 264 Percent of Symptom Reports
Specific Symptoms by Frequency Reports (N = 551) Number of Reported Symptoms
Location of Specific Symptoms by Frequency of Reports (N = 551) Symptom Location Number of Reported Symptoms
Location of Specific Symptoms by Frequency of Reports (N = 551) Symptom Location Number of Reported Symptoms


![2013 Deaths by Auto Accidents [infographic]](https://cdn4.slideserve.com/7225868/slide1-dt.jpg)