Download

1 / 26
260 likes | 386 Vues
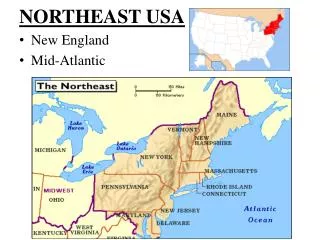
Northeast State’s Improving the Quality of Site Characterization. Consultant’s Perspective How the Triad Approach Works to Our Advantage and Does It Make Cents?. Robert M. Burger, President ESN North Atlantic 800-880-0533.

E N D
Northeast State’s Improving the Quality of Site Characterization Consultant’s Perspective How the Triad Approach Works to Our Advantage and Does It Make Cents? Robert M. Burger, President ESN North Atlantic 800-880-0533
If the Regulatory Communityembraces it, and the Consulting Community thinks it will work, what more do we need? • The ultimate client, either private or government and the public must believe it will provide a quicker, less costly and more accurate solution! • The ultimate client wants solutions, not reports and data.
ESN North Atlantic is committed to the Triad Approach • Our business is 100% based on providing the support services the Triad Approach needs! • We collectively have over 75 years experience researching/designing and using Triad (interactive) approach. • Used approach on 1000+ sites in past 10 years, from ½ day due diligence to multi-year Superfund. • Developed/refined many of the tools/techniques currently used. We pioneered the use of direct push and field analysis in New England over twelve years ago.
How did we arrive at this approach? • In order to be more competitive, we looked at areas where we could reduce time and costs yet increase the level of site understanding: • Quicker/less costly/more flexible sub-surface sampling – Direct Push • Immediate chemical data – mobile laboratories • Use of geophysics • Concurrent collection of characterization and engineering information, presumptive solutions. • Net result = more projects, more revenue, less time/project!
Implementing the Triad Approach at all sites • The key is to understand the client’s requirements, what is the goal for the project, i.e. due diligence, risk assessment, clean-up, etc. • Collect and ascertain as much historical, physical, and chemical information as possible. • Work backwards from the project goals to develop the generic data needs to support a solution, e.g., where were the chemicals deposited, how are they moving in the environment and where are they likely to harm or be in contact with the eco-system?
Tools that work for all sites: • Conceptual site model • Direct push sampling • Geophysics • Field-based analytics • Conceptual site model refinement in the field
Direct Push • At over 90% of all sites in New England, direct push is a good investigation tool in the overburden. • We can collect soil, water, vapor samples quickly, inexpensively, and with minimal hazard to the operators and the public. • It can also be used to perform remedial option testing, i..e. vapor extraction, material injection, etc. • Also use to apply geophysics, borehole logging for soil lithology collection.
Geophysics • GPR/magnetometer – define lithology, utility corridors, etc. • Borehole geophysics – collect more stratigraphy data quickly. • Cone Penetrometer – lithologic/physical data
Field-based Analytics • If you collect soil, water or vapor, you need to know what chemicals are present and at what concentration, why wait? • If you can analyze it in a fixed base lab you can analyze it in the field! • Do I need to also send samples to a fixed –base lab…. No! • Can I use the data for risk and closure if I need to…yes!
Wide variety of field analytics to choose from • Screening level • Hand-held PID/FID • IR/UV • XRF • Immunoassay • Wet chemistry
Quantitaive/Qualitative Field Analytics • GC • GC/MS • AA/GFAA/ICP • FTIR
Which field analytic method is best? • Screening data can be useful, e.g., soil vapor can quickly cover a large area at low cost. • However, thorough and detailed analysis can be as quick as most screening techniques! • Why spend the time and money for screening level data if you can get qualitative data as fast and inexpensively?
Our experience over past 15 years suggests • Most screening data ends up in a database for the site. • Inevitably, someone tries to compare or extrapolate screening data with lab data,e.g., soil vs soil vapor/headspace. • Someone wants to use screening data for risk/engineering decisions
ESN Solution – field tested and client approved! • Modify SW-846 methods, trim methods of time and expense • Micro-scale sample extractions/preparations • Optimize target analyte list for project – no such thing as standard target list • End result – performance based method • End result – analyze volatiles in < 15-20 minutes, SVOA < 15-30 minutes • We vary QA/QC from minimal to complete depending upon data use.
Does it Make Cents? • We can analyze/report 12- 25 samples plus QC per standard day for $1000 - $2500 • The per sample cost is usually same as fixed-base lab costs or 50% of cost with 24 hour turnaround! • The data report is available immediately! • As fast as samples are collected, they are analyzed, avoiding areas of non-detect, minimizing time/costs that are not project productive. • On-site analytics are focused on the project, chemist is part of decision making process, can suggest re-sampling, etc.
Have we received regulatory buy-in? • Generally, in New England, Yes! We have used field analysis for a variety of end uses and have gained acceptance on a project by project basis. • We may have to provide project specific SOP’s • We may need to perform LCS analysis and meet other regulatory requirements prior to analysis. • We have an open door policy to all reviewers, our system/data and methods are open to scrutiny at any time!
Triad Approach Advantages • Shortest project turnaround possible – end of day – data available • Minimal down time • No lag between sampling and lab data • Minimal concerns over preservation of sample, immediate analysis avoids many of the issues. • Also collect data for remedial design concurrent with characterization
Triad Approach Disadvantages • Need backup/support for staff/equipment • Empowered decision makers need to be on-site to make decisions! • Need professionals that can synthesize geology/hydrogeology/chemistry/regulatory information.
Barriers to Use • Myths still exist: • that SW-846 methods are definitive • that field analysis can only be used for screening • all field analysis programs must split samples to off-site lab for confirmation. • all groundwater data must come from monitoring wells • On-site analytical instruments are unreliable and won’t stand up to the rigors of the field.
Project Examples – Due Diligence, Merger & Acquisition Example 1 • Fortune 500 Company, 5 properties in 3 states, needed environmental data to confirm purchase price • Designed conceptual approach using existing data/Phase II invest. Info., followed state regs for analysis. • Used direct push for sampling, collected soil/water samples from manufacturing plants, analyzed on-site, re-directed invest. immediately
Project Examples – Due Diligence, Merger & Acquisition Example 1 • Use of field GC analysis yielded fingerprint for TPH primarily hydraulic fluid, not gasoline, reduced expected clean-up costs significantly! • Completed all sites within 2 weeks, reported data/findings/recommendations to client on day of sale! • Approx. cost = ½ of traditional approach, 1/3 of traditional time
State/Federal Program Characterization Examples – Remedial Investigation • Naval Aviation Facility – previous investigation yielded pump/treat system, not performing. • Designed soil vapor delineation, soil and water sampling/analysis as well as SVE testing program. • Within 2 weeks, completed product delineation, installed/tested SVE option, completed soil/water analysis to confirm vapor program.
State/Federal Program Characterization Examples – Remedial Investigation • Collected 150+ samples/analyzed, installed and tested SVE system, measured performance, radius of influence, etc. • At end of 2 week program, remedial option proposed, data collected used for design. • Program cost = ½ of conventional approach, ¼ of time.
State/Federal Program Characterization Examples – Remedial Investigation • DOT facility – previous investigation revealed soil and groundwater areas of concern. • Client wanted to quantify and move to remediation quickly. • Designed soil sampling/analysis for PAH’s, groundwater sampling/analysis for VOC by GC. • 2 day program collected soil and groundwater samples/analysis to quantify extent of both.
Brownfield/CERCLA/RCRA Examples • Region I Superfund/DOD facility – many point sources suspected, some data to suggest leach fields, sanitary discharges. • Designed direct push sampling/on-site analysis using GCs and GFAA for metals to characterize soil/groundwater. • Interactive sampling/analysis used to confirm/refute conceptual site model developed.
Brownfield/CERCLA/RCRA Examples • Over period of 4-6 weeks, collected/analyzed 1000+ samples, no off—site analysis or confirmation analysis required. • State provided LCS/review of SOP’s. • Program was considered model at time, cost = $500k vs original estimate of $1.0-1.5M, time was ¼ of original estimate.