Materials Characterization
Materials Characterization. Foothill College Nanotechnology Program. Overview. The case for materials characterization Approaches to characterization Categories of instrumental techniques Who uses these tools? What kinds of problems?. Instrument Rubric. What is the physics?

Materials Characterization
E N D
Presentation Transcript
Materials Characterization Foothill College Nanotechnology Program
Overview • The case for materials characterization • Approaches to characterization • Categories of instrumental techniques • Who uses these tools? • What kinds of problems?
Instrument Rubric • What is the physics? • What is the information? • What types of materials? • Industry use / adoption • What types of problems?
Categories of Materials Characterization Techniques • Image • Surface • Structural • Organic • Elemental
Image Analysis • Optical microscopy • Confocal microscopy • SEM/EDX – Scanning Electron Microscopy with Energy Dispersive X-Ray detector • SPM – Scanning Probe Microscopy • AFM – Atomic Force Microscopy • TEM – Transmission Electron Microscopy
Surface Analysis • AES – Auger Electron Spectroscopy • XPS – X-Ray Photoelectron Spectroscopy • TOF-SSIMS – Time of Flight Static Secondary Ion Mass Spectroscopy • LEED – Low Energy Electron Diffraction
Structural Analysis • XRD – X-Ray Diffraction • XAX/EXAFS - X-ray Absorption Spectroscopy and Extended X-Ray Absorption Fine Structure • Raman spectroscopy • TEM – Transmission Electron Microscopy • EELS – Electron Energy Loss Spectroscopy (typically combined with TEM)
Organic Analysis • FTIR – Fourier Transform Infrared Spectroscopy • GC/MS – Gas Chromatography with Mass Spectroscopy (detector) • HPLC – High Performance Liquid Chromatography • Raman spectroscopy (structural organic)
Elemental Analysis • ICP – Inductively Coupled Plasma • XRF – X-Ray Fluorescence • PIXE - Particle-Induced X-ray Emission • Optical atomic spectroscopy • CHN (Carbon / Hydrogen / Nitrogen)
Industries Served • Semiconductor (electronics) • Magnetic storage (disks/drives) • Biomedical device (biomaterials) • Thin films (material coatings) • Chemical / plastics (polymers) • Clean energy technology (PV) • Consumer Packaged Goods (CPG)
Types of Problems • Materials characterization • Process development • Failure analysis • QA/QC • Authenticity • Competitive analysis
Optical Microscopy • First place you want to ‘look’ in failure analysis • Metallography • ‘Inexpensive’ in comparison • $1K to $10K • Contrast/dark field
Scanning Probe Microscopy (SPM) Family of Instruments “Scanning Probe Microscopy (SPM) is a branch of microscopy that forms images of surfaces using a physical probe that scans the specimen. An image of the surface is obtained by mechanically moving the probe in a raster scan of the specimen, line by line, and recording the probe-surface interaction as a function of position. SPM was founded with the invention of the scanning tunneling microscope in 1981. Many scanning probe microscopes can image several interactions simultaneously. The manner of using these interactions to obtain an image is generally called a mode.” http://en.wikipedia.org/wiki/Scanning_probe_microscopy
Metrology of Metals • AFM can be used to understand surface morphology. • This material was prepared using a spray / cast technique.
Metrology of Structures • The pattern and depth of this micro lens can be determined using an AFM. • This helps in both development and process control.
Scanning Electron Microscopy (SEM) “A scanning electron microscope (SEM) is a type of electron microscope that images a sample by scanning it with a high-energy beam of electrons in a raster scan pattern. The electrons interact with the atoms that make up the sample producing signals that contain information about the sample's surface topography, composition, and other properties such as electrical conductivity.” http://en.wikipedia.org/wiki/Scanning_electron_microscope
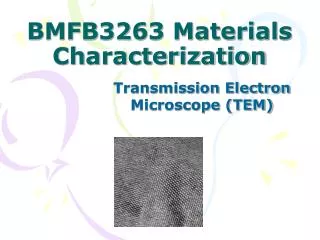
Transmission Electron Spectroscopy (TEM) Transmission electron microscopy (TEM) is a microscopy technique whereby a beam of electrons is transmitted through an ultra thin specimen, interacting with the specimen as it passes through. An image is formed from the interaction of the electrons transmitted through the specimen; the image is magnified and focused onto an imaging device, such as a fluorescent screen, on a layer of photographic film, or to be detected by a sensor such as a CCD camera. http://en.wikipedia.org/wiki/Transmission_electron_microscopy
TEM Diagram SiC / Ytterbium dopant “Advanced structural ceramics offer important advantages over current materials used in high-temperature environments, such as increased thermal stability, oxidation resistance, and high strength. However, the inherently brittle nature of ceramics limits the use of materials like SiC and Si3N4 in applications such as ultra-high temperature turbine engines. the controlling factors for producing crack deflection, which leads to high toughness, include the stiffness of the grain boundary phase (present in liquid-phase sintered products) and the toughness of the interface between the grain boundary and the matrix grains. Both of these can be altered by the choice of dopants used during sintering. By tailoring the fracture properties of SiC, starting from the atomic level, we are working towards the goal of improving the fracture toughness and reliability of brittle materials. ” http://www.lbl.gov/ritchie/Programs/SIC/tSIC.html
Auger Electron Spectroscopy (AES) • Surface sensitive • Qualitative • Semi-quantitative • Depth profiling • Elemental mapping http://cmm.mrl.uiuc.edu/techniques/CMM_AES.html
Auger Electron Process Initial excitation event Secondary internal event Ejection of Auger electron
Auger Survey Spectra • 0 to 2000 eV • Detects elements > Li • Semi-quantitative • Fairly fast • Conductive materials • Spatial resolution down to 100A on newer instruments
AES Elemental Mapping • Spatial resolution, fast data collection of AES, and surface sensitivity, allows x-y (image) mapping of elements. • Helpful to show both distribution and spatial correlation of elements, inferring chemical bonding assignments.
Al/Pd/GaN Thin Film Example (cross section)
X-Ray Photoelectron Spectroscopy (XPS) SSX-100 University of Toronto
The Photoelectric Process Ejected Photoelectron Incident X-ray Free Electron Level • XPS spectral lines are identified by the shell from which the electron was ejected (1s, 2s, 2p, etc.). • The ejected photoelectron has kinetic energy: KE=hv-BE- • Following this process, the atom will release energy by the emission of an Auger Electron. Conduction Band Fermi Level Valence Band 2p L2,L3 2s L1 1s K
XPS Chemical Shifts • Chemical shifts of photoelectrons allow for interpretation and assignment of chemical bonding states. In PET polymer the C-C, C-O, and O-C=O peaks are clearly resolved. The area under the curve is proportional to the number of atoms in that chemical state. NREL data
XPS Chemical Shifts • The chemical shift between aluminum metal and aluminum oxide is ~ 3 eV and clearly resolved. The oxide film thickness can be estimated from the oxide/metal peak ratio and the escape depth of the Al 2p photoelectron Al 2p XPS spectrum of native aluminum oxide
Time of Flight (TOF) SIMS Time of Flight – Secondary Ion Mass Spectroscopy and Time-of-flight mass spectrometry (TOFMS) is a method of mass spectrometry in which an ion's mass-to-charge ratio is determined via a time measurement. Ions are accelerated by an electric field of known strength. TOF-SIMS and AES surface analysis equipment can be used to detect and characterize micro-area contaminants or patterned features on magnetic media or read/write heads with sub-micron spatial resolution. http://www.phi.com/surface-analysis-applications/magnetic-media.html
LEED – Low Energy Electron Diffraction “Low-energy electron diffraction (LEED) is a technique for the determination of the surface structure of crystalline materials by bombardment with a collimated beam of low energy electrons (20-200eV) and observation of diffracted electrons as spots on a fluorescent screen. LEED may be used both qualitatively and quantitatively in constructing a representation of surface structure and atomic positions.” http://en.wikipedia.org/wiki/Low-energy_electron_diffraction
Infrared Spectroscopy “The infrared portion of the electromagnetic spectrum is usually divided into three regions; the near-, mid- and far- infrared, named for their relation to the visible spectrum. The higher energy near-IR, 14000–4000 cm−1 (0.8–2.5 μm wavelength) can excite overtone or harmonic vibrations. The mid-infrared, ~4000–400 cm−1 (2.5–25 μm) may be used to study the fundamental vibrations and associated rotational-vibrational structure. The far-infrared, ~400–10 cm−1 (25–1000 μm), lying adjacent to the microwave region, has low energy and may be used for rotational spectroscopy. The names and classifications of these subregions are conventions, and only loosely based on the relative molecular or electromagnetic properties”. (Wikipedia) http://en.wikipedia.org/wiki/Infrared_spectroscopy
Fourier Transform Infrared Spectroscopy (FTIR) http://www.wcaslab.com/tech/tbftir.htm
Chromatography http://en.wikipedia.org/wiki/Chromatography
High Performance Liquid Chromatography (HPLC) http://en.wikipedia.org/wiki/Chromatography
Raman Spectroscopy Raman spectroscopy (named after C. V. Raman) is a spectroscopic technique used to study vibrational, rotational, and other low-frequency modes in a system. It relies on inelastic scattering, or Raman scattering, of monochromatic light, usually from a laser in the visible, near infrared, or near ultraviolet range. http://en.wikipedia.org/wiki/Raman_spectroscopy
XRD/XAX/EXAFS X-ray scattering techniques are a family of non-destructive analytical techniques which reveal information about the crystallographic structure, chemical composition, and physical properties of materials and thin films. These techniques are based on observing the scattered intensity of an X-ray beam hitting a sample as a function of incident and scattered angle, polarization, and wavelength or energy. http://en.wikipedia.org/wiki/X-ray_diffraction
X-Ray Diffraction X-ray diffraction yields the atomic structure of materials and is based on the elastic scattering of X-rays from the electron clouds of the individual atoms in the system. The most comprehensive description of scattering from crystals is given by the dynamical theory of diffraction (Wikipedia X-ray scattering techniques) http://pubs.usgs.gov/of/2001/of01-041/htmldocs/xrpd.htm
X-Ray Diffractometer “Powder diffraction (XRD) is a technique used to characterize the crystallographic structure, crystallite size (grain size), and preferred orientation in polycrystalline or powdered solid samples. Powder diffraction is commonly used to identify unknown substances, by comparing diffraction data against a database maintained by the International Centre for Diffraction Data. It may also be used to characterize heterogeneous solid mixtures to determine relative abundance of crystalline compounds and, when coupled with lattice refinement techniques, can provide structural information on unknown materials. Powder diffraction is also a common method for determining strains in crystalline materials. “ http://pubs.usgs.gov/of/2001/of01-041/htmldocs/xrpd.htm http://en.wikipedia.org/wiki/X-ray_diffraction
Inductively Coupled Plasma (ICP) MS Inductively coupled plasma mass spectrometry (ICP-MS) is a type of mass spectrometry that is highly sensitive and capable of the determination of a range of metals and several non-metals at concentrations below one part in 1012 (part per trillion). It is based on coupling together an inductively coupled plasma as a method of producing ions (ionization) with a mass spectrometer as a method of separating and detecting the ions. http://en.wikipedia.org/wiki/Inductively_coupled_plasma_mass_spectrometry
X-Ray Fluorescence (XRF) X-ray fluorescence (XRF) is the emission of characteristic "secondary" (or fluorescent) X-rays from a material that has been excited by bombarding with high-energy X-rays or gamma rays. The phenomenon is widely used for elemental analysis and chemical analysis, particularly in the investigation of metals, glass, ceramics and building materials, and for research in geochemistry, forensic science and archaeology.
Failure Analysis (FA) • Failure of metals: • Weld analysis • Image analysis • Metal composition • Grain boundaries • Brittle failure • Stress/strain • Corrosion http://www.g2mtlabs.com/metallography/metallurgical-testing-in-houston/