Radiation
70 likes | 198 Vues
Radiation is energy emitted in waves or particles, vital for life as we know it. All objects radiate at different wavelengths, with peak emissions depending on their temperature. Higher temperatures result in shorter wavelengths and more energy. Weather radar uses specific wavelengths to detect precipitation and its intensity, factoring in the size of the target. Absorption and reflection of solar radiation are influenced by an object's color and albedo. This balance of radiation determines net heating or cooling, affecting climate and weather patterns. ###

Radiation
E N D
Presentation Transcript
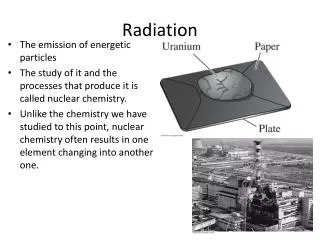
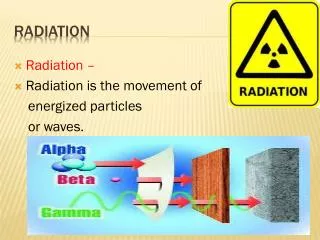
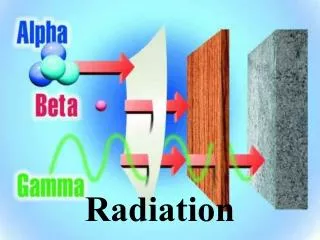
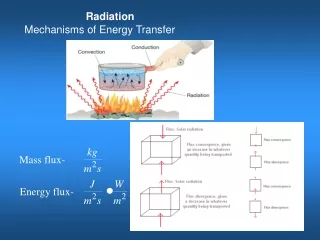
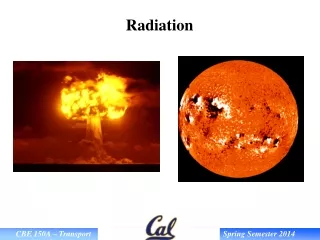
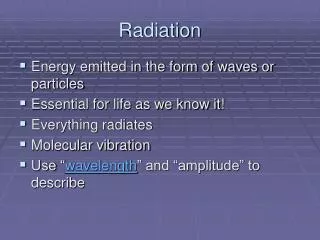
Radiation • Energy emitted in the form of waves or particles • Essential for life as we know it! • Everything radiates • Molecular vibration • Use “wavelength” and “amplitude” to describe
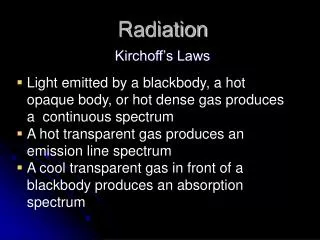
The Electromagnetic Spectrum • All objects emit some radiation at ALL wavelengths • Each object has a wavelength of peak emission • Shorter wavelength = more energy
Weather Radar Basics • An instrument that emits (transmits) radiation at a pre-selected wavelength based upon the size of the target you want to see • Smaller wavelength for smaller targets • A receiver detects reflected radiation • Intensity of precipitation • Distance to precipitation; (D=VxT)/2
Temperature • A measure of the average kinetic energy of the molecules of a substance • The greater the kinetic energy (molecular motion) the greater the temperature • Higher temperature = more energy emitted • More energy = shorter wavelength of peak emission (sun vs. earth)
Balance of Radiation • Objects constantly absorbing and emitting radiation • NET HEATING = absorption > emission • NET COOLING = emission > absorption
Absorption / Reflection • COLOR of object determines amount of absorption of solar radiation • Light objects = poor absorbers (good reflectors) high ALBEDO (reflectivity from 0 to 1) • Dark objects = good absorbers; low ALBEDO • INTENSITY also determines how much solar radiation is absorbed by an object (SUN ANGLE)
Key Figures • 2.2, 2.3, 2.7, 2.8, 2.17, 2.18, 2.20 • From last time… • Table 1.1, Fig. 1.3, 1.42