Vulnerability analysis: Methodologies, Purpose, and Policy Application
This paper by Susanne Milcher from UNDP discusses the critical need for vulnerability analysis in shaping policies aimed at poverty reduction and economic development. It contrasts qualitative and quantitative approaches to data collection, providing examples such as interviews with people living with HIV/AIDS and surveys on marginalized communities like the Roma. The document emphasizes the importance of understanding socio-economic factors, disaggregation of data, and the role of indicators in formulating effective policies and monitoring their impact on vulnerable groups, highlighting the necessity of trust and community participation.

Vulnerability analysis: Methodologies, Purpose, and Policy Application
E N D
Presentation Transcript
Vulnerability analysis:Methodologies, Purpose, and Policy Application Susanne Milcher Specialist, Poverty and Economic Development UNDP Regional Centre Bratislava (14 June 2006)
Outline • The need of analysis and data for policy/project design and monitoring • Qualitative versus quantitative approach • Examples of both approaches: • Semi-structured interviews/focus groups on people living with HIV/Aids • Household survey on Roma and the displaced
Need of vulnerability analysis • How can vulnerable groups, their causes of exclusion and particular needs be identified without disaggregated quantitative data (multidimensional aspects, double marginalisation)? • How can national-level policies that aim ensuring the sustainable inclusion of vulnerable groups be designed and resources be allocated without estimates of their size, problems and causes of problems? • How can priorities and sector capacity deficiencies be identified without complementary in-depth qualitative research? • How can policies be monitored and evaluated on their impact on vulnerable groups without data?
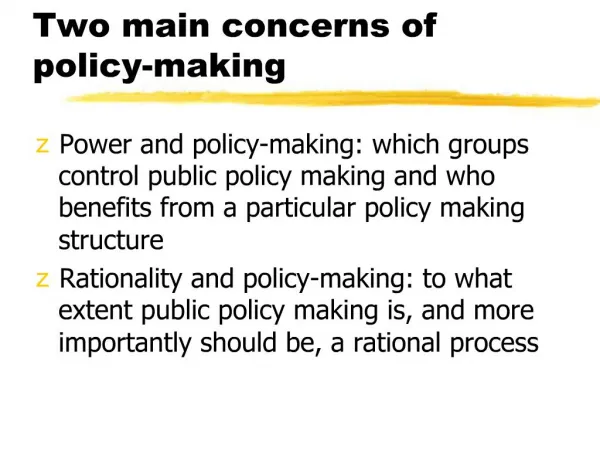
The need of analysis • What kind of analysis? • Socioeconomic status • Human rights aspects • Legal aspects (frameworks) • Who elaborates it? • The issue of trust and credibility • Participation • Who is its target? • Public en large • National governments • International organizations/partners
The role of data/indicators • Relevant profiles of vulnerability in the region are necessary for adequate programmatic and policy responses • Those most in need remain “hidden” behind the national averages • Without a clear picture of the status and determinants of exclusion and/or discrimination, actions are rather intuitive • Can any analyses, resource allocation and policy be serious if not backed by data? • Setting targets, baselines • Monitoring the progress • Measuring the outcomes • Assessing the impact
Quantitative versus qualitative approach • Quantitative approach • Theory, hypotheses (i.e. women are more vulnerable to poverty because they face higher unemployment, lower education, discrimination, etc.) • Indicators needed (employment rate, unemployment rate, poverty rate, educational attainments) • Data collection (labour force survey) – questions on employment activity, income in the last month, job search, educational attainments and enrolment – individual level data to be able to account for sex, age, ethnicity, etc.) • Goal => Status registration, correlations and causal links
Quantitative versus qualitative approach (cont.) • Qualitative approach • Social reality, social constructs • The meaning and reasons of human actions and decision-making result from interaction and therefore can only be observed through understanding the social structures determining these actions • Information/data collection (interviews, observation, focus groups) – e.g. information on the extent and types of discrimination, quality of social services, satisfaction of beneficiaries • Theory, hypotheses development • Goal => Perceptions and attitudes registration, priority identification
Characteristics of quantitative research • Representative and comparable • Causal analysis, identification of inequalities • Researcher pre-determines the communication (close) • Limited participation • Hypotheses, questionnaires, (random) sampling, fieldwork • Objective and distanced analysis • Conclusions based on a statistical logical analysis (deductive)
Characteristics of qualitative research • Interactive and communicative • Hypotheses developing • Interpretative, understanding linkages • Dynamic and flexible process • Subjective • Theoretical sampling • Explanatory data analysis • Conclusions based on repeated experiences (inductive)
Criticism to both approaches • Qualitative: • - sample too small (1-5 people or single case study) • - analysis not representative, subjective • - cannot make generalizations • Quantitative: • - distance to reality • - reductive • - limited participation or dynamic interaction
Which approach to choose? • Choose the approach that better fits to the type of information you want to get (status or perceptions) and the need for this information (resource allocation, priority setting, causal analysis) • Combining both approaches for proper vulnerability analysis possible but time and cost-extensive • Better use existing data and research, proxies • Both approaches have to be adapted to objective of research and social reality (i.e. MDG indicators, questions to address gender or issues,sampling and fieldwork; focus group design, types of questions asked, moderation)
Example: People living with HIV/Aids • Type of information collected • Perceptions of people living with HIV/Aids and relevant stakeholders on the type of challenges for this group and the institutions in terms of access, quality and availability to health care, education, employment • Process • Identification of participants, close cooperation with NGOs working with target community • Develop focus groups/interviews sensitive and responsive to different sub-groups (IDUs, men having sex with men, sex workers and parental infected children) • Questions and moderation • Transcript processing and analysis
Example: Roma and displaced household survey (cont.) • Type of information collected • Status of Roma, displaced (IDPs/refugees) and majority living in close proximity and determinants of vulnerability • Process • Two separate questionnaires (status of the household and of each individual member) • Sampling – households in areas with compact Roma population (municipalities or neighborhoods with share of Roma population at and above the national average), majorities living in close proximity to Roma and IDPs/refugees where relevant • Fieldwork (interviewer training, Roma assistant interviewers) • Data clean up, processing and analysis
Example: Roma and displaced household survey (cont.) • MDG indicators: poverty rate, enrolment rate, maternal and infant mortality rate, access to water and sanitation • Social exclusion indicators: (long-term) unemployment rate, ethnic and gender ratio of unemployment, items in household, political participation, access to health and credit services, land • Vulnerability profiles of all members of the household (special needs of elderly, women, children, low educated, unemployed, poor) • Comparability across countries • Comparability to national HBS and LFS could give an idea of the distance from national averages • Data on the status of “non-Roma living in close proximity” could give an idea of the non-group related determinants of vulnerability
Thank you! • Bratislava Regional Center • 35 Grosslingova • 81109 Bratislava, Slovak Republic • +421 2 59337 111 • www.undp.org/europeandcis • http://roma.undp.sk • http://vulnerability.undp.sk