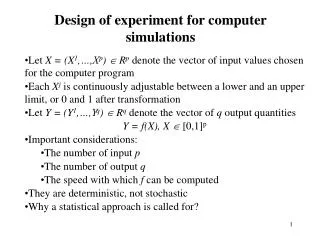
Experiment Design for Computer Scientists
Experiment Design for Computer Scientists. Marie desJardins ( mariedj@cs.umbc.edu ) CMSC 601 March 7, 2012. Sources. Paul Cohen, Empirical Methods in Artificial Intelligence , MIT Press, 1995. Tom Dietterich, CS 591 class slides, Oregon State University.


Experiment Design for Computer Scientists
E N D
Presentation Transcript
Experiment Design for Computer Scientists Marie desJardins (mariedj@cs.umbc.edu) CMSC 601 March 7, 2012
Sources • Paul Cohen, Empirical Methods in Artificial Intelligence, MIT Press, 1995. • Tom Dietterich, CS 591 class slides, Oregon State University. • Rob Holte, “Experimental Methodology,” presented at the ICML 2003 Minitutorial on Research, ‘Riting, and Reviews.
Experiment design • Experiment design criteria: • Claims should be provable • Contributing factors should be isolated and controlled for • Evaluation criteria should be measurable and meaningful • Data should be gathered onconvincing domain /problem • Baselines should be reasonable • Results should be shown to be statistically valid s s
Provable Claims • Many research goals start out vague: • Build a better planner • Learn preference functions • Eventually, these claims need to be made provable: • Concrete • Quantitative • Measurable • Provable claims: • My planner can solve large, real-world planning problems under conditions of uncertainty, in polynomial time, with few execution-time repairs. • My learning system can learn to rank objects, producing rankings that are consistent with user preferences, measured by probability of retrieving desired objects.
More Provable Claims • More vague claims: • Render painterly drawings • Design a better interface • Provable claims: • My system can convert input images into drawings in the style of Matisse, with high user approval, and with measurably similar characteristics to actual Matisse drawings (color, texture, and contrast distributions). • My interface can be learned by novice users in less time than it takes to learn Matlab; task performance has equal quality, but takes significantly less time than using Matlab.
One More • Vague claim: • Visualize relational data • Provable claim: • My system can load and draw layouts for relational datasets of up to 2M items in less than 5 seconds; the resulting drawings exhibit efficient screen utilization and few edge crossings; and users are able to manually infer important relationships in less time than when viewing the same datasets with MicroViz.
Measurable Criteria • Ideally, your evaluation criteria should be: • Easy to measure • Reliable (i.e., replicable) • Valid (i.e., measuring the right thing) • Applicable early in the design process • Convincing • Typical criteria: • CPU time / clock time • Cycles per instruction • Number of [iterations, search states, disk seeks, ...] • Percentage of correct classification • Number of [interface flaws, user interventions, necessary modifications, ...] Adapted with permission from Tom Dietterich’s CS 519 (Oregon State University) course slides
Meaningful Criteria • Evaluation criteria must address the claim you are trying to make • Need clear relationship between the claim/goals and the evaluation criteria • Good criteria: • Your system scores well iff it meets your stated goal • Bad criteria: • Your system can score well even though it doesn’t meet the stated goal • Your system can score badly even though it does meet the stated goal
Example 1: CISC • True goals: • Efficiency (low instruction fetch, page faults) • Cost-effectiveness (low memory cost) • Ease of programming • Early metrics: • Code size (in bytes)Entropy of Op-code field • Orthogonality (can all modes be combined?) • Efficient execution of the resulting programs was not being directly considered • RISC showed that the connection between the criteria and the true goals was no longer strong • → Metrics not appropriate! Adapted with permission from Tom Dietterich’s CS 519 (Oregon State University) course slides
Example 2: MYCIN • MYCIN: Expert system for diagnosing bacterial infections in the blood • Study 1 evaluation criteria were: • Expert ratings of program traces • Did the patient need treatment? • Were the isolated organisms significant? • Was the system able to select an appropriate therapy? • What was the overall quality of MYCIN’s diagnosis? • Problems: • Overly subjective data • Assumed that experts were ideal diagnosticians • Experts may have been biased against the computer • Required too much expert time • Limited set of experts (all from Stanford Hospital) Adapted with permission from Tom Dietterich’s CS 519 (Oregon State University) course slides
MYCIN Study 2 • Evaluation criteria: • Expert ratings of treatment plan • Multiple-choice rating system of MYCIN recommendations • Experts from several different hospitals • Comparison to study 1: • Objective ratings • More diverse experts • Still have assumption that experts are right • Still have possible anti-computer bias • Still takes a lot of time Adapted with permission from Tom Dietterich’s CS 519 (Oregon State University) course slides
MYCIN Study 3 • Evaluation criteria: • Multiple-choice ratings in a blind evaluation setting: • MYCIN recommendations • Novice recommendations • Intermediate recommendations • Expert recommendations • Comparison to study 2: • No more anti-computer bias • Still assumes expert ratings are correct • Still time-consuming (maybe even more so!) Adapted with permission from Tom Dietterich’s CS 519 (Oregon State University) course slides
MYCIN Results • Experts don’t always agree • Method appears valid (more experience → higher ratings) • MYCIN is doing well! Adapted with permission from Tom Dietterich’s CS 519 (Oregon State University) course slides
MYCIN Lessons Learned • Don’t assume experts are perfect • Find out how humans are evaluated on a similar task • Control for potential biases • Human vs. computer, Stanford vs. other institutions, expert vs. novice • Don’t expect superhuman performance • Not fair to evaluate against “right” answer • ...unless you evaluate humans the same way • ...and even then may not measure what you care about (performance under uncertainty) Adapted with permission from Tom Dietterich’s CS 519 (Oregon State University) course slides
Baseline: Point of Comparison • Performance can’t be measured in isolation • Often have two or three baselines: • A reasonable naive method • Random • No processing • Manual • Naive Bayes • The current state of the art • Optimal or upper-bound solution • Ablation • Test the contribution of one factor • Compare system X to (system X – factor)
Poor Baselines • No baseline • The naive method, and no other alternative • A system that was the state of the art ten years ago • The previous version of your own system • What if there is no existing baseline?? • Develop reasonable baselines • Decompose and find baselines for the components
Establish a Need • Try very simple approaches before complex ones • Try off-the-shelf approaches before inventing new ones • Try a wide range of alternatives, not just ones most similar to yours • Make sure comparisons are fair Thanks to Rob Holte for permission to use this slide
Solution Quality (% of optimal) Test Alternative Explanations Combinatorial auction problems CHC = hill-climbing with a clever new heuristic Thanks to Rob Holte for permission to use this slide
Percentage of CHC solutions better than random HC solutions Is CHC Better than Random HC ? ! Thanks to Rob Holte for permission to use this slide
Look at Your Data • 4 x-y datasets, all with the same statistics. • Are they similar ? Are they linear ? • mean of the x values = 9.0 • mean of the y values = 7.5 • equation of the least-squared regression line is: y = 3 + 0.5x • sum of squared errors (about the mean) = 110.0 • regression sum of squared errors = 27.5 • residual sum of squared errors (about the regression line) = 13.75 • correlation coefficient = 0.82 • coefficient of determination = 0.67 F.J. Anscombe (1973), "Graphs in Statistical Analysis," American Statistician, 27, 17-21 Thanks to Rob Holte for permission to use this slide
Anscombe Datasets Plotted Thanks to Rob Holte for permission to use this slide
Look at Your Data, Again • Japanese credit card dataset (UCI) • Cross-validation error rate is identical for C4.5 and 1R Is their performance the same ? Thanks to Rob Holte for permission to use this slide
Closer analysis reveals… Error rate is the same only on the dataset class distribution • ROC curves • Cost curves • Learning curves C4.5 1R Thanks to Rob Holte for permission to use this slide
Statistical Methods • Plotting the data • Sample statistics • Confidence intervals • Bootstrap, t distribution • Comparing distributions • Bootstrap, t test, confidence intervals • Learning algorithms • Regression • ANOVA