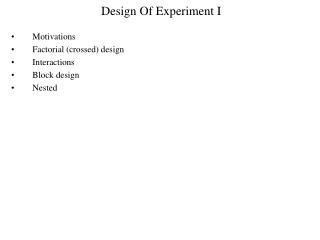
Design experiment
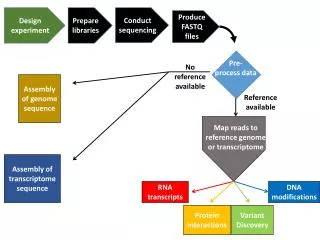
Design experiment. Prepare libraries. Conduct sequencing. Produce FASTQ files. Pre- process data. No reference available. Assembly of genome sequence. R eference available. Map reads to reference genome or transcriptome. Assembly of transcriptome sequence. RNA transcripts.

Design experiment
E N D
Presentation Transcript
Design experiment Prepare libraries Conduct sequencing Produce FASTQ files Pre-process data No reference available Assembly of genome sequence Reference available Map reads toreference genomeor transcriptome Assembly of transcriptome sequence RNAtranscripts DNA modifications ProteinInteractions VariantDiscovery
Produce FASTQ files Conduct sequencing Pre-process data Design experiment Prepare libraries Auer & Doerge, 2010 Genetics 185:405-16 DNA sequences A DNA sequences B Fu et al, 2014, PNAS 111:1891-6 Map reads toreference genomeor transcriptome
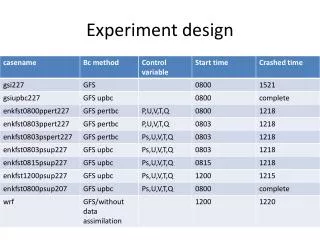
Experimental design Genetics 185(2):405-16, 2010 Here seven treatments are applied to each of three biological replicates , and each sample is sequenced in a separate lane Are nuisance effects confounded with treatment effects?
Experimental design Yes – all samples from each rep are on the same flowcell. Flowcelleffects are confounded with replicate effects, and lane effects are confounded with treatments, because T1 is always in lane 1, T2 in lane 2, and so forth. Genetics 185(2):405-16, 2010
Experimental design Auer & Doerge, Genetics 185:405, 2010
Experimental design Same experiment: seven treatments applied to each of three biological replicates , but samples are allocated differently Are nuisance effects confounded with treatment effects now? Auer & Doerge, Genetics 185:405, 2010
Experimental design No – biological replicates are randomized across flowcells, and treatments are randomized across lanes. Biological sources of variation (reps) are orthogonal to technical sources (flowcells and lanes). Auer & Doerge, Genetics 185:405, 2010
Produce FASTQ files Conduct sequencing Pre-process data Design experiment Prepare libraries Auer & Doerge, 2010 Genetics 185:405-16 DNA sequences A DNA sequences B Fu et al, 2014, PNAS 111:1891-6 Map reads toreference genomeor transcriptome
Molecular indexing measures bias Abundant transcripts are detected more times than there are unique start/stop sites for sequence reads Fu et al, PNAS 111:1891–1896, 2014
The more steps, the greater the sample loss… Even with estimated 70% yield at each step, the cumulative yield after 15 steps in RNA-seq library production is very low Fu et al, PNAS 111:1891–1896, 2014
Produce FASTQ files Conduct sequencing Pre-process data Design experiment Prepare libraries Auer & Doerge, 2010 Genetics 185:405-16 DNA sequences A DNA sequences B Fu et al, 2014, PNAS 111:1891-6 Map reads toreference genomeor transcriptome
Retrieve genome annotation from database DNA sequences A DNA sequences B Map reads toreference genomeor transcriptome Merge read alignment with genome annotation to produce tables with counts of aligned reads per genome feature BAM file A Count table A BAM file B Count table B
Table of differentially-expressed genes with annotation Genome annotation from database Merge read alignment with genome annotation to produce tables with counts of aligned reads per genome feature Count table A Statistical comparison of counts, inference of differential expression Count table B
Align reads to reference Assemble transcripts Merge across treatments Count reads per treatment for assembled transcripts, adjusting for bias detected in start- or end-points of RNA fragments to more accurately estimate transcript levels (Roberts et al., Genome Biol 12:R22, 2011) Count reads per treatment for assembled transcripts Visualize differential expression results From http://cufflinks.cbcb.umd.edu/