Design an Experiment
Design an Experiment . Like a Real Scientist!!. Let’s review what science is. This should do it. (7:30 – witches). And that elusive definition of a THEORY (7:30) http:// www.youtube.com/watch?v=9Re8QxKZdm0 And a LAW is what?. Research question .


Design an Experiment
E N D
Presentation Transcript
Design an Experiment Like a Real Scientist!!
Let’s review what science is • This should do it. (7:30 – witches). • And that elusive definition of a THEORY (7:30) • http://www.youtube.com/watch?v=9Re8QxKZdm0 • And a LAW is what?
Research question • Start with the general topic, then narrow it down to a more specific question. Often you will start with an observation. • Example: I don’t hear as much about those energy drinks as I used to; maybe they were just a fad that will pass, like yoga pants and wearing boots in the middle of the summer. I wonder if they ever really worked in the first place.
Hypothesis • Be specific. • It must be testable. • Example: If energy drinks work, then people will still be using them because people are always seeking ways to get more energy. • Is this testable? Is this science? Economics? Dependent variable? Independent? Assumptions? Rewrite?
What did you come up with? ExperimentalHypotheses example: We’ll revisit the energy drinks later. And a dirty trick called the null hypothesis. Now back to our little shrimps!
Notice that these statements contain the words , if andthen and because. They are not necessary in a formalized hypothesis, but it helps make it consistent for you. But not all if-then statements are hypotheses. For example, "If I play the lottery, then I will get rich." This is a simple prediction. In a formalized hypothesis, a tentative relationship is stated. For example, if the frequency of winning is related to frequency of buying lottery tickets. "Then" is followed by a prediction of what will happen if you increase or decrease the frequency of buying lottery tickets. Then the reason follows the word “because”.
Choose your subjects • This is often a matter of availability and cost, unless you had a specific subject in mind from the start, like those little brine shrimp that it would be a good time to get back to.
Choose your equipment • This will often depend on availability and cost.
Dependent Variable? • What will you measure? How, exactly? • Decide what is best.
Speaking of Measuring… • Be very careful and PRECISE when you measure. • If your measuring tool is not digital, you are allowed and EXPECTED to judge to one digit past the smallest marks on the device. • For example, if your meter stick is marked off (graduated) in millimeters, don’t round to centimeters. Carefully judge to tenths of a millimeter.
Variable control • Think of ALL the variables that may affect your dependent one. Research is necessary here, as well as common sense. • Now plan for exactly HOW you will control all these. • “Control” means to keep them the same for all subjects, right?
Control group? • This is a different concept than controlling variables, but is related. The control group will help control variables, but it’s main purpose is to give you something to compare your experimental group(s) to. • How do you know your independent variable has ANY effect? • Sometimes there won’t be a control group. Boys vs. girls heartrates, for example.
Practice? You talking about practice? • Have you accounted for a practice effect? • How about a fatigue effect? • If you have groups, are they about the same?
Repetition • In order for your results to reliably and validly show the affect of the independent variable, you want to test it repeatedly. • This can be done either with repeated measurements of the same subject, or with many subjects. • At least 10 subjects in each group is a good idea.
As you Plan… • Keep remembering your hypothesis. Don’t start adding other factors like…
Blind? Double blind? • If it applies, the subjects should not know what treatment they are getting as it might affect their response to it. • The classic example is with medicine. If you have a group getting a medicine and a control group getting a placebo (like a pill that has no medicine in it), the subjects should not know which they are getting (they should be blind). • Double blind would be when the giver of the medicine doesn’t know which one it is.
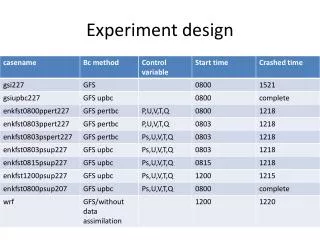
How to record data? • Construct a table. • Consult The Use of Tables and Figures.
How to analyze data? • Compare using statistics. • T-test? Chi square? • Remember, you are trying to take judgment and subjectivity out of the picture. • This null hypothesis thing is tricky!
The null hypothesis • For no good reason but to torture us with confusion, statisticians have invented something they call the NULL hypothesis. • Basically, it is the hypothesis that would predict your independent variable would have NO effect. • So what would be an example of a null hypothesis for our lab? • And what would a chi square test tell us?
Constantly observe!! • Observe if what you are doing is what you intended to do. • If anything happens that you think might affect the experiment, make detailed notes of it as you experiment so that you can consider how you will account for it when all is said and done. Use a lab notebook for this. • For example…?
Then what, to make this SCIENCE? • Then your write-up is sent to a journal for a critical step – peer review. • A group of experts (peers) will dissect your paper and see if it holds up to intense scrutiny. • Did you control all variables? • Did you do the analysis (math) correctly? • Did you come to a valid conclusion based on the results? • Then – the Nobel Prize, and you are famous!
So let’s watch this and review • http://www.youtube.com/watch?v=zcavPAFiG14 • 10 min. • A few practice questions, if time?
5. Ants and beetles compete for resources in some elevations. Scientists collected leaf litter from different elevations. The scientists recorded the number of ants & the number of beetles found in the leaf litter at each elevation and created graphs showing the data. Which conclusion do the data BEST support? A. Ants are the prey species of beetlesB. Ants have high survival rates with fewer competitors.C. Ants have large populations when many beetles are in the communityD. Ants are more likely to survive at higher elevations that at lower elevations.
6. Cells known as “chemoreceptors” respond to changes in the carbon dioxide level of the blood. When these chemoreceptors are stimulated, they send impulses that increase breathing. The increased breathing lowers the blood’s carbon dioxide level. The body typically functions best when the level of carbon dioxide is 40 mm Hg. When the chemoreceptors encounter carbon dioxide levels higher than this, they increase their activity. Which of these graphs best shows the relationship between level of carbon dioxide and chemoreceptor activity?
7. A horticulturist hypothesized that if he increases the level of carbon dioxide (CO2) in the air of his greenhouses, then his plants will absorb carbon more quickly. He collected the following data from an experiment performed on his plants. • Which statement is true about the data in the table? • The data supports the hypothesis because the plants grew more when the level of CO2 increased. • The data supports the hypothesis because the plants grew less when the level of CO2 increased. • The data contradicts the hypothesis because plants grew less when the level of CO2 increased. • The data contradicts the hypothesis because the plants grew more when the level of CO2 increased.
9. The graphs (below) show the results of 2 separate experiments on the same species of plant. Students now want to determine how the use of rainwater or bottled water affects the growth of this plant. Which conditions should be used for optimal growth as the 2 water types are tested? • 20°C, 10 mL/day • 25°C, 35 mL/day • 30°C, 45 mL/day • 35°C, 20 mL/day
10. These three samples from the same live bacterial culture were all viewed at the same magnification. Which conclusion is best supported by observation of these three samples? • The bacterial culture was unaffected by the chemical agent. • The sampling techniques used did not produce accurate data. • The culture became contaminated by airborne bacteria during the initial sampling • The culture included some bacteria that were resistant to the chemical agent.
11. Many residents in a small town have developed a bacterial infection. Two students hypothesize that the bacteria are coming from the town’s drinking water. They look for the bacteria in water samples from the lake that supplies about 80% of the town’s drinking water. When they find no bacteria, the students conclude that the town’s residents are not getting the bacteria from their drinking water. Which is a source of error in the students’ experimental design? • Water from the lake was not tested for other possible pathogens. • Residents of other nearby towns were not tested for the bacteria. • The residents’ genetic predisposition for getting ill was not determined. • Other sources of drinking water were not tested for bacteria.