Understanding Profitability Ratios: Key Metrics for Assessing Financial Performance
80 likes | 225 Vues
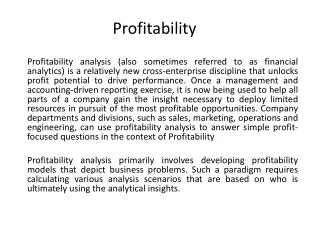
Profitability ratios are critical financial metrics that evaluate how effectively a firm utilizes its assets and controls expenses to achieve a satisfactory return on investment. Key measures include Gross Profit Ratio, Operating Margin Ratio, and Net Profit Ratio, each offering insights into operational efficiency. Additionally, Return on Investment (ROI), Return on Assets (ROA), and Return on Capital Employed (ROCE) gauge profitability concerning equity and total assets. A higher ROCE indicates better capital usage, essential for assessing investment opportunities and organizational efficiency.

Understanding Profitability Ratios: Key Metrics for Assessing Financial Performance
E N D
Presentation Transcript
Profitability Ratios By: Maninder Pal Singh
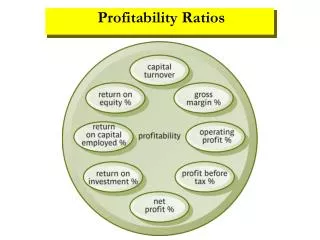
Profitability ratios measure the firm's use of its assets and control of its expenses to generate an acceptable rate of return. • Different measures of Profit – Gross and Net: • Gross profit: Net Sales – Cost of goods sold. • Net Profit: Gross Profit – Total Operating Expenses.
Profitability ratios includes: • Gross Profit Ratio: Gross Profit / Net sales x 100 • Operating Margin Ratio: Operating Income/ Net sales x 100 (Operating income is the difference between operating revenues and operating expenses)
Net Profit Ratio: Net Profit / Net sales x 100 • Return on Investment (ROI) or Return on Owners’ Equity: Net Income / Shareholders Equity x 100 • Return on Assets (ROA): Net Income / Total Assets x 100 • Return on Capital Employed (ROCE): Net Income Before Interest and Tax / Capital Employed (Shareholders' equity represents the remaining interest in assets of a company, spread among individual shareholders of common or preferred stock) (Capital Employed: Total Assets - Current Liabilities)
(When evaluating investment opportunities, profits are often measured per share) • Earnings Per Share: Net Profit After Tax and Dividends / Shareholder’s Equity • Dividend Yield Ratio: Dividends per Share / Market Value per Share
Profitability: • The higher the better. • Shows how effective the firm is in using its capital to generate profit. • A ROCE of 25% means that it uses every Rs.1 of capital to generate 25paise in profit. • Partly a measure of efficiency in organisation and use of capital.