Download
1 / 50
510 likes | 811 Vues
Landsat-7 ETM+ Radiometry Instrument-Based Stability/Calibration for Level-OR Characterization & Correction. The Art and Precision of ETM+ Radiometry 5. Path-Processing (PP) IC Characterization. 2:00-2:45 PM Tuesday, 28 November 2006 Landsat Calibration Working Group (LCWG) Meeting

E N D
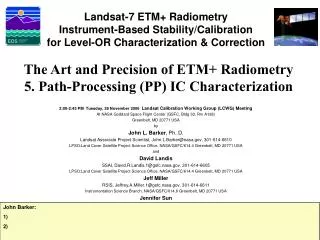
Landsat-7 ETM+ Radiometry Instrument-Based Stability/Calibrationfor Level-OR Characterization & Correction The Art and Precision of ETM+ Radiometry 5. Path-Processing (PP) IC Characterization 2:00-2:45 PM Tuesday, 28 November 2006 Landsat Calibration Working Group (LCWG) Meeting At NASA Goddard Space Flight Center (GSFC, Bldg 33, Rm A128) Greenbelt, MD 20771 USA by John L. Barker, Ph. D. Landsat Associate Project Scientist, John.L.Barker@nasa.gov, 301-614-6610 LPSO:Land Cover Satellite Project Science Office, NASA/GSFC/614.4 Greenbelt, MD 20771 USA and David Landis SSAI, David.R.Landis.1@gsfc.nasa.gov, 301-614-6605 LPSO:Land Cover Satellite Project Science Office, NASA/GSFC/614.4 Greenbelt, MD 20771 USA Jeff Miller RSIS, Jeffrey.A.Miller.1@gsfc.nasa.gov, 301-614-6611 Instrumentation Science Branch, NASA/GSFC/614.6 Greenbelt, MD 20771 USA Jennifer Sun SSAI, Jennifer.B.Sun@gsfc.nasa.gov, 301-614-6618 LPSO:Land Cover Satellite Project Science Office, NASA/GSFC/614.4 Greenbelt, MD 20771 USA John Barker: 1) 2)
Agenda of Workshop on The Art and Precision ofLandsat-7 ETM+ Radiometry • 9:00 1. Approach to On-Board Characterization of ETM+ • 10:00 2. Landsat-7 ETM+ MOC and PCD Telemetry • 11:00 3. IAS-Based IC Lamp Characterization • 12:00 Lunch • 13:30 4. Path-Processing (PP) of ETM+ Background • 14:30 5. PP-Based IC Lamp Characterization John Barker: 1) IC trend is relatively linear/stable after 2.6 y, after 4.2y 2) Principle components, graying of all bands, internal IC optics ( Dichroics or ND filters) needs to be done to agree to Lamp-2 3_need sensitivity curves on orbit
Overview of Talk 5. Path-Processing IC CharacterizationThe Art & Precision of ETM+ Radiometry Why is on-orbit IC lamp characterization important? Scientists need stability to ± 0.1 % IC trending errors are about ± 0.1 % IC measurements are made every scan Why is path-processing (PP) important IC pulses require 10’ to equilibrate modeling this equilibration is easier with PP than with traditional scene-average results The ETM+ detector responsivity is constant over many scenes John Barker: 1) IC trend is relatively linear/stable after 2.6 y, after 4.2y 2) Principle components, graying of all bands, internal IC optics ( Dichroics or ND filters) needs to be done to agree to Lamp-2 3_need sensitivity curves on orbit
Landsat-7 ETM+ Radiometry Talk 4. LPSO Path-Processing of ETM+ Background Averaged Along-Track Per-Scan Background John Barker: 1) 2)
B1D15_BF333_DCR_251TA1 vs t_onAveraged Per-Scan BackgroundIf this is random, should TA_B be used instead of B?
B2D12_BF333_DCR_251TA1 vs t_onAveraged FWD-Scan BackgroundIf this is random, should TA_B be used instead of B?
B2D12_BR333_DCR_251TA1 vs t_onAveraged REV-Scan BackgroundObservation BF=BR (10.106 vs 10.107 DN)
B3D8_BF333_DCR_251TA1 vs t_onAveraged Per-Scan BackgroundIf this is random, should TA_B be used instead of B?
B4D7_BF333_DCR_251TA1 vs t_onAveraged Per-Scan BackgroundIf this is random, should TA_B be used instead of B?
B5D14_BF333_DCR_251TA1 vs t_onAveraged Per-Scan BackgroundIf this is random, should TA_B be used instead of B?
B7D9_BF333_DCR_251TA1 vs t_onAveraged Per-Scan BackgroundIf this is random, should TA_B be used instead of B?
B8D27_BF333_DCR_251TA1 vs t_onAveraged Per-Scan BackgroundIf this is random, should TA_B be used instead of B?
Landsat-7 ETM+ Radiometry Talk 4. LPSO Path-Processing of ETM+ Background Averaged Along-Track “Zero-Radiance” “Per-Pixel Noise” John Barker: 1) 2)
B1D15_SD_QF_DCR_TA vs t_onTA Zero-Radiance “Per Pixel Noise”
B2D12_SD_QF_DCR_TA vs t_onTA Zero-Radiance “Per Pixel Noise”
B2D12_SD_QR_DCR_TA vs t_onTA Zero-Radiance “Per Pixel Noise”Observation SD_QF=SD_QR (±0.5604 vs ±0.5599 DN)
B5D14_SD_QF_DCR_TA vs t_onTA Zero-Radiance “Per Pixel Noise”
B8D27_SD_QF_DCR_TA vs t_onTA Zero-Radiance “Per Pixel Noise”
Landsat-7 ETM+ Radiometry Talk 4. LPSO Path-Processing of ETM+ Background Memory Effect Test (FWD & REV) FASC Region B2D12 Doubly Averaged for equal error Per-Scan Background Before, During and After DC Restore BF_bDCR, BF_DCR, BF_aDCR BR_bDCR, BR_DCR, BR_aDCR John Barker: 1) 2)
BF_bDCR Within-Region Slope A1 * 10**6 = 2.92 DN/scanB2D12_BF333_bDCR_2x251TA1 Averaged FWD-Scan Background
BF_DCR Within-Region Slope A1 * 10**6 = 0.43 DN/scanB2D12_BF333_DCR_2x251TA1 Averaged FWD-Scan Background
BF_aDCR Within-Region Slope A1 * 10**6 = 0.24 DN/scanB2D12_BF333_aDCR_2x251TA1 Averaged FWD-Scan Background
BR_bDCR Within-Region Slope A1 * 10**6 = 0.42 DN/scanB2D12_BR333_bDCR_2x251TA1 Averaged REV-Scan Background
BR_DCR Within-Region Slope A1 * 10**6 = 0.30 DN/scanB2D12_BR333_DCR_2x251TA1 Averaged REV-Scan Background
BR_aDCR Within-Region Slope A1 * 10**6 = 1.12 DN/scanB2D12_BR333_aDCR_2x251TA1 Averaged REV-Scan Background
B2D12_QF_TA & ResidualsWithin IAS 500 mf Bkgd SlopeFWD Scan-1 Before Lamp Turn-On, 2002NOV14 FASC
B2D12_QF_TA & ResidualsWithin IAS 500 mf Bkgd SlopeFWD Scan-801 Before Sunrise, 2002NOV14 FASC
B2D12_QF_TA & ResidualsWithin IAS 500 mf Bkgd SlopeFWD Scan-6401 FASC Solar Region, 2002NOV14
B2D12_QF_TA & ResidualsWithin IAS 500 mf Bkgd SlopeFWD Scan-10401 Solar Max, 2002NOV14 FASC
B2D12_QR_TA & ResidualsWithin IAS 500 mf Bkgd SlopeREV Scan-0 Before Lamp Turn-On, 2002NOV14 FASC
B2D12_QR_TA & ResidualsWithin IAS 500 mf Bkgd SlopeREV Scan-800 Before Solar Sunrise, 2002NOV14 FASC
B2D12_QR_TA & ResidualsWithin IAS 500 mf Bkgd SlopeREV Scan-6400 FASC Solar Region, 2002NOV14
B2D12_QR_TA & ResidualsWithin IAS 500 mf Bkgd SlopeREV Scan-10400 Solar MAX, 2002NOV14 FASC
PP Pulse Normalization FitTalk 5. LPSO Path-Processing IC Characterization John Barker: 1) Tim and Emily and Dennis, 9:35 2)
P4 Integration Single-Pass PrecisionSD_Loc (MF) ~ ± 0.2 - ±0.4 FWD, ±0.1 - ±0.3 REV SD_FWHM (mf) ~ ±0.006 (Pulse is stable) REV FWHM 0.5mf (1%) wider
IC Precision and Trending Talk 5. LPSO Path-Processing IC Characterization Temperature-Correction (within-band) up to 0.3 % Current-Equilibration (within-band) up to 2 % Current-Normalization (within-band) -1 to +7 % IC Between-Bands Normalization up to 6 % John Barker: 1) IC trend is relatively linear/stable after 2.6 y, after 4.2y 2) Principle components, graying of all bands, internal IC optics ( Dichroics or ND filters) needs to be done to agree to Lamp-2 3_need sensitivity curves on orbit
ConclusionsTalk 5. LPSO Path-Processing IC Characterization Path-processing software exists for within-scan and along-track monitoring three regions within the Level-0R image and five regions within the in the calibration file pre-shutter bDCR, DCR and aDCR backgrounds FWD & REV P4 IC pulse integration precise for LOC & FWHM John Barker: 1) IC trend is relatively linear/stable after 2.6 y, after 4.2y 2) Principle components, graying of all bands, internal IC optics ( Dichroics or ND filters) needs to be done to agree to Lamp-2 3_need sensitivity curves on orbit
Operational IAS Background RecommendationsTalk 5. LPSO Path-Processing IC Characterization Use 333 mf shutter region within DC Restore (DCR) to avoid on/off DCR spikes instead of current 500 mf region John Barker: 1) IC trend is relatively linear/stable after 2.6 y, after 4.2y 2) Principle components, graying of all bands, internal IC optics ( Dichroics or ND filters) needs to be done to agree to Lamp-2 3_need sensitivity curves on orbit
IC Research Recommendations(1 of 2)Talk 5. LPSO Path-Processing IC Characterization Quantify TSL7-dependence of FWD, REV and AVE IC Cross-validate fitted MOC and PCD telemetry recommend IAS use of MOC telemetry Cross-validate path-processing with scene-based IC Cross-validate path-processing with scene-based FASC John Barker: 1) IC trend is relatively linear/stable after 2.6 y, after 4.2y 2) Principle components, graying of all bands, internal IC optics ( Dichroics or ND filters) needs to be done to agree to Lamp-2 3_need sensitivity curves on orbit
IC Research Recommendations(2 of 3)Talk 5. LPSO Path-Processing IC Characterization Aggregate along-track within-scan IC spectra and their variability in order to produce a “super spectrum” IC pulse profile at 0.01 mf resolution for monitoring pulse shape with time and considering a known shape for pulse integration Recommend new background collect windows for IAS to avoid DC Restore (DCR) on/off spikes Cross-validate path-processing with scene-based bkgd John Barker: 1) IC trend is relatively linear/stable after 2.6 y, after 4.2y 2) Principle components, graying of all bands, internal IC optics ( Dichroics or ND filters) needs to be done to agree to Lamp-2 3_need sensitivity curves on orbit
IC Research Recommendations(2 of 2)Talk 5. LPSO Path-Processing IC Characterization Characterize possible reflective band memory effects using before, during and after DCR backgrounds for both forward and reverse scans with FASC collects, including slope variations within bkgd regions Test for potential use of background average rather than line-by-line background John Barker: 1) IC trend is relatively linear/stable after 2.6 y, after 4.2y 2) Principle components, graying of all bands, internal IC optics ( Dichroics or ND filters) needs to be done to agree to Lamp-2 3_need sensitivity curves on orbit
Lamp-Based Radiometry Future Imagers Yes, lamps are potentially usable on future missions Pre-select lamps for stability during burn-in Design needs as much of optics as possible; ideally all Provide selectable on/off constant-radiance mode Include temperature, voltage and current monitors Pre-launch multi-year in-vac testing of lamp & IC optics current, voltage, resistance & T dependences spectral “graying” for between-band use Design sensitivity tests for on-orbit use for corrections Provide dynamic range for testing lamps together Use at least 4 lamps for logarithmically different use John Barker: 1) IC trend is relatively linear/stable after 2.6 y, after 4.2y 2) Principle components, graying of all bands, internal IC optics ( Dichroics or ND filters) needs to be done to agree to Lamp-2 3_need sensitivity curves on orbit
Lamp-Based Calibration of Future Imagers Talk 5. LPSO Path-Processing IC Characterization Place temperatures monitors required for health and safety in positions to allow for optimum on-board modeling of system performance. Use triply redundant monitoring for any telemetry required for quantitative calibration. Use 12- or 16-bit transmission of telemetry Place heaters required for health and safety of the instrument in places that allow for on-orbit temperature sensitivity measurements. John Barker: 1) IC trend is relatively linear/stable after 2.6 y, after 4.2y 2) Principle components, graying of all bands, internal IC optics ( Dichroics or ND filters) needs to be done to agree to Lamp-2 3_need sensitivity curves on orbit
Lessons Learned About IAS-IC Scene-Based TrendingTalk 5. LPSO Path-Processing IC Characterization Transparency is needed at all levels of management There is no substitute for co-operative relationships during the design, testing and on-orbit operational phases between engineers responsible for the instrument and scientists responsible for the on-going operational characterization and calibration of its imagery. Continuity of funding of scientific personnel is essential Only the scientific users can be counted on to maintain the multi-decade expertize and interest in designing, characterizing and calibrating current and future satellite remote sensing imagers. John Barker: 1) IC trend is relatively linear/stable after 2.6 y, after 4.2y 2) Principle components, graying of all bands, internal IC optics ( Dichroics or ND filters) needs to be done to agree to Lamp-2 3_need sensitivity curves on orbit
Agenda of Workshop on The Art and Precision ofLandsat-7 ETM+ Radiometry • 9:00 1. Approach to On-Board Characterization of ETM+ • 10:00 2. Landsat-7 ETM+ MOC and PCD Telemetry • 11:00 3. IAS-Based IC Lamp Characterization • 12:00 Lunch • 13:30 4. Path-Processing (PP) of ETM+ Background • 14:30 5. PP-Based IC Lamp Characterization John Barker: 1) IC trend is relatively linear/stable after 2.6 y, after 4.2y 2) Principle components, graying of all bands, internal IC optics ( Dichroics or ND filters) needs to be done to agree to Lamp-2 3_need sensitivity curves on orbit