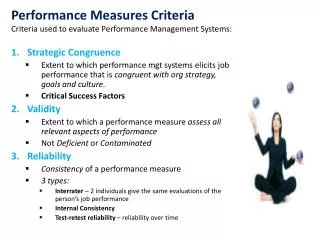
A Model to Evaluate Recreational Management Measures
190 likes | 307 Vues
This study presents a detailed approach to evaluating recreational fishing management measures, specifically focusing on the stock assessment of summer flounder. Two models estimate landings and catches by size class under various proposed regulations such as size and possession limits. Using logistic and multinomial logistic regression techniques, we analyze the likelihood of fish being landed in given size categories. The findings aim to inform regulatory decisions and enhance management strategies for sustainable recreational fisheries.

A Model to Evaluate Recreational Management Measures
E N D
Presentation Transcript
A Model to Evaluate Recreational Management Measures • Objective I • Stock Assessment Analysis • Create a model to distribute estimated landings (A + B1 fish) by size class. • Create a model to distribute estimated catch (A + B1 +B2 fish) by size class
A Model to Evaluate Recreational Management Measures • Objective II • Estimates of landings and catch for different proposed recreational fishery regulations • Size limits • Possession limits • Abundance
I. Logistic Analysis • The logit model where multiple possible outcomes exist can be extended to a multinomial model referred to as a generalized or baseline-category logit model of the form (McFadden, 1974): • Log(Pr(Y=i|x)/Pr(Y=k+1|x)) = αi + β’i x i = 1,. . . .,k • αi = the intercept parameters, and • βi= the vector of the slope parameters.
Analysis of Maximum Likelihood Estimates for the Probability that a Fish will be Landed in a Given Size CategoryExtra-Fishery Variables Parameter DF Estimate Standard Wald Error Chi-Square Pr > ChiSq sfldp 1 -0.8373 0.0477 308.1836 <.0001 FPPI 1 0.0034 0.000272 156.1948 <.0001 pr 1 0.0702 0.00567 153.3822 <.0001 NP 1 7.46E-09 2.71E-09 7.545 0.006 NPd 1 -0.4741 0.0488 94.5362 <.0001 omega3 1 -0.1824 0.0397 21.0956 <.0001
Analysis of Maximum Likelihood Estimates for the Probability that a Fish will be Landed in a Given Size CategoryRecreational Fishing Experience Variables Parameter DF Estimate Standard Wald Error Chi-Square Pr > ChiSq Weight 1 -12.2533 0.0418 86011.0892 <.0001 TotSFL 1 0.000036 6.19E-06 33.7463 <.0001 SSB 1 -8.86E-06 2.03E-06 19.0343 <.0001 PARTY 1 -0.00268 0.000621 18.646 <.0001
Analysis of Maximum Likelihood Estimates for the Probability that a Fish will be Landed in a Given Size CategoryRegulatory Variables Parameter DF Estimate Standard Wald Error Chi-Square Pr > ChiSq minsLm 1 -0.0211 0.013 2.6174 0.1057 minslmi 1 0.0287 0.00497 33.3697 <.0001 PosLmt 1 0.00231 0.00153 2.279 0.1311 ARecTrgt 1 -0.00214 0.000296 51.966 <.0001
Numbers of Summer Flounder LandedMinimum Size = 16Possession Limit = 3
II. Quick Assessment Method • The first model (m1) predicts the number of fish landed (Type A + B1 fish) in a state that have been intercepted, identified, measured, and in some cases weighted by observers (TotSFLnmbr). • The second model (m2) predicts the total number of fish (Type A+B1+B2 fish) reported to observers by anglers who did not necessarily allow them to be identified, measured, and weighted by observers (TotSFLnd).
QAM: Scatter Plot • Two scatter plots at the end of the program provide a comparison of the actual and predicted values of these two dependent variables. • These plots indicate that most predicted values fall within narrow bands around the actual values of the variables; this reflects the coefficient of determination of 76.7 and 76.8 percent, respectively.
Summer flounder recreational management measures by state, 2012.
Proposed Regulations • Season length = 153 days • Abundance = 60074 • Possession Limit = 3, 4, and 5 fish • Minimum Size Limit = 16 and 17 inches • Landed = A + B1 fish • Caught = A + B1 + B2 fish • Inshore Regulations = Offshore Regulations
Numbers of Coast Wide Fish Landed (A + B1) andCaught (A + B1 + B2)(000 of fish) Minimum Size Possession Limit Numbers Landed Numbers Caught (inches) (number of fish) (Type A+B1) (Type A+B1+B2) -------------------------------------------------------------------------------------------------------- 16 3 1585 3715 16 4 1777 4032 16 5 1941 4296 -------------------------------------------------------------------------------------------------------- 17 3 1668 3750 17 4 1870 3982 17 5 2043 4530
Summary • This model is a simple application of time proven methods of dealing with imperfect information in a marketplace or natural environment. • While the concepts are simple, their actual application is complex. • A step by step user guide is provided in the appendix attached. • The programs in steps I to VII are used if the existing data set is to be modified for another species of recreationally harvested fish. • These steps will update the database needed to estimate a new sets of coefficients for use in a policy analysis of any existing or proposed fishery management regulations.