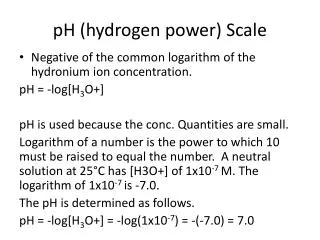
Download
1 / 8
100 likes | 368 Vues
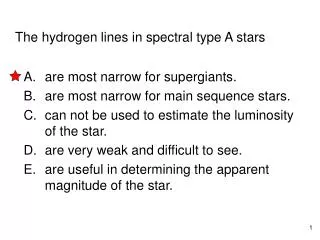
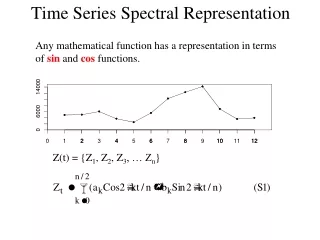
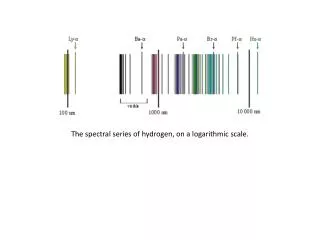
The spectral series of hydrogen, on a logarithmic scale. Lyman series of hydrogen atom spectral lines in the ultraviolet. The four visible hydrogen emission spectrum lines in the Balmer series. H-alpha is the red line at the right.

E N D
Lyman series of hydrogen atom spectral lines in the ultraviolet
The four visible hydrogen emission spectrum lines in the Balmer series. H-alpha is the red line at the right. En http://chemistry.bd.psu.edu/jircitano/periodic4.html aparece la tabla periodica y cliqueando en el elemento se muestra el espectro de emisioncorrespondiente.
The diagram to the right illustrates the formation of three series of spectral lines in the atomic emission spectrum of hydrogen.
The Rutherford–Bohr model of the hydrogen atom (Z = 1) or a hydrogen-like ion (Z > 1), where the negatively charged electron confined to an atomic shell encircles a small, positively charged atomic nucleus and where an electron jump between orbits is accompanied by an emitted or absorbed amount of electromagnetic energy (hν).[1] The orbits in which the electron may travel are shown as grey circles; their radius increases as n2, where n is the principal quantum number. The 3 → 2 transition depicted here produces the first line of the Balmer series, and for hydrogen (Z = 1) it results in a photon of wavelength 656 nm (red light).
The Franck-Hertz Experiment In 1914, James Franck and Gustav Hertz performed an experiment which demonstrated the existence of excited states in mercury atoms, helping to confirm the quantum theory which predicted that electrons occupied only discrete, quantized energy states. Electrons were accelerated by a voltage toward a positively charged grid in a glass envelope filled with mercury vapor. Past the grid was a collection plate held at a small negative voltage with respect to the grid. The values of accelerating voltage where the current dropped gave a measure of the energy necessary to force an electron to an excited state.
The Bohr-Sommerfeldmodelsuggested that electrons travel in elliptical orbits around a nucleus. This model supplemented the quantized angular momentum condition of the Bohr model with an additional radial quantization condition, the Sommerfeld-Wilson quantization, where pr is the radial momentum canonically conjugate to the coordinate q which is the radial position and T is one full orbital period. The integral is the action of action-angle coordinates. This condition is suggested by the correspondence principle.