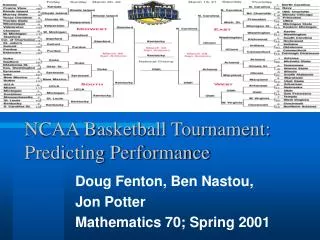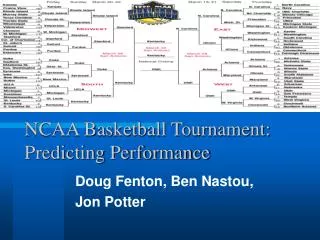
Understanding and Predicting Basketball RPI: Strategies for Accurate Estimation
250 likes | 367 Vues
The Ratings Percentage Index (RPI) is a crucial metric for assessing college basketball teams, combining win/loss percentages and strength of schedule. Calculated using a team's weighted wins and losses, RPI can help the NCAA selection committee determine team seeding and at-large bids. While it provides insights into team strength, it should not be solely relied upon. Predicting RPI involves game outcome simulations and statistical analysis, using resources like KenPom to enhance accuracy. This overview explores its calculations and applications in the context of NCAA tournament selections.

Understanding and Predicting Basketball RPI: Strategies for Accurate Estimation
E N D
Presentation Transcript
What is RPI? • Ratings Percentage Index • Based on win/loss percentage throughout the season. • Not necessarily a predictor of a stronger team.
How is RPI Calculated? • Weighted wins, losses • Wins worth 1.4 away, 1 neutral, .6 at home • Losses worth 1.4 at home, 1 neutral, .6 away • Two parts: • Win pct (wins/(wins+losses) • Strength of schedule • Opponents unweighted win pct • Opponents’ opponents unweighted win pct
What is RPI used for? • Estimator of team strength, as it factors in strength of schedule • Helps to seed the NCAA tournament. • Helps selection committee/analysts determine quality of wins.
The Selection Committee • 10-person committee that determines who will receive an at-large bid and seeding for the tournament • 5 year Tenure • Use multitude of selection tools • Win/loss • Conference strength • How a team won • Voodoo • Apparently, more random numbers than me. • Decidedly NOT just RPI.
How can RPI be predicted? • Predict outcomes of games • Run through season • Rinse, repeat (Monte-Carlo!)
Kenpom statistics • Statistics on all division 1 basketball teams • Offensive Efficiency • Defensive Efficiency • Tempo • Average possesions per game: FGA-OR+TO+.42 FTA • Meteorologist from Salt Lake City, Utah • Basketball stats just a hobby, no background • Stats referenced by ESPN, wall street journal • Season averages
Step 1: Predicting games • Generate scores: compare and mark • Home games: • xscore<-round(x[8]/100*rnorm(1,1.05,.2)*(((x[4]+y[4])/2)*rnorm(1,1.1,.2))+((y[12]*rnorm(1,1.05,.2))/80)) • yscore<-round(y[8]/100*rnorm(1,.95,.2)*(((y[4]+x[4])/2)*rnorm(1,.9,.2))+((x[12]*rnorm(1,.95,.2))/80))
Step 2: Recording data • Compare scores • Higher score wins • Mark wins/losses in appropriate places
Step 3: Run through season • 5284 division 1 vs division 1 games. • Import list of all games, which team is home, away, to be called and put into game function. • Run 1 of three game situations based on court (1 is home, 2 is away, 3 is neutral). • Each team plays approximately 30 games.
Step 4: Compile RPI, rank, repeat! • After season is done, run through game list to grab opponent’s win-losses. • Next, re-run through game list to grab opponent’s opponent’s win-losses by.
What do these results mean? • Interesting estimator, but cannot be taken too seriously. • True Top 25 RPI missed by average of 13 places. • My top 25 missed true RPI by average of 11. • Kansas, WVU right where they should be! • Villanova ranked 18, therefore project should be considered a success.
Is the RPI reliable? • [252]Wake Forest(7.4%), [202]DePaul (9.9%) more likely to make tournament than nearly 200 other teams based on RPI alone. • Too much weight placed on who you play, not how you play. • Still only one factor in determining NCAA tournament.
Interesting Oddities • Program took over 15 hours to run. • In 10,000 simulated seasons, 31 teams will not receive an at-large bid (will not be in the top 37 RPI at the end of the season) • Of those 31 teams, half of them would likely end up as a play-in team going to the final four. • VCU received at large bid with RPI rank of 49 (to fill 36th-38th at large bid), Harvard with RPI rank of 35 denied tournament bid
Are these results reliable? • Maybe? • Only 2 teams predicted correctly in top 25. • Season averages inaccurate for day-of play, but might average out over whole season. • Effect of random variables should eventually absorb things like suspensions, injuries, team morale. • Possible that one of the seasons actually matches this season perfectly.
Theoretical/Technical Issues • Unable to account for mid-season tournaments, changes in schedule, delayed games. • ‘Labor Intensive’ program – 5 trillion calculations. • Still near-impossible to seed mock tournament without just taking 68 highest RPI (which might not be a bad idea)
March Madness • There are about 14,757,395,260,000,000,000 different brackets of the NCAA tournament (but only 1 winner!) • Over 6 million brackets were submitted to ESPN.com this march in competition. • Of those brackets, the best bracket, just 1 of 6 million, got 52, or 77.6% of their picks correct. • This year was the first time 2 11 seeds made the sweet 16, and the first time no 1 or 2 seeds made the final 4. • Most even field the tournament has ever had, no great teams
My terrible bracket • My original bracket: • 33.6th percentile on ESPN at 480 pts (4-millionth place) Champion: Notre Dame • No final four team, only 2 elite 8 (UNC, Uconn) Basically, terrible. Last place in every pool I was in.
Can I make my bracket any better? • This year, no, but next year? Maybe! • Goal: create a bracket based on Kenpom rankings, and see if it does any better.
Results: • Worth twice as many points on ESPN, enough to put me in the 92nd percentile! • Beat 5,520,000 brackets! • Still had no final 4 team.
Is it a reliable method? Votes for no: • Highest championship percentage was less than 6%, only 4% better than flipping a coin. • Many games were decided by less than a percentage point • Doesn’t take into account injuries, coaching, stage fright, ‘home field,’ streaks, incredible ability to lose the lead, or recruiting violations. Examples: • Georgetown and St. Johns both had their star players hurt going into the tournament and lost in the first round. • Tennessee head coach Bruce Pearl was hit with school and NCAA sanctions the day before the game and lost by 30 points. • George Mason entered the tournament on an 11 game wn-streak
Votes for Yes: • Randomness exists to account for the issues previously mentioned. • Anything can happen, this season could have been that 1 in 10,000 chance for VCU, data could be reliable. • 55.2% of the bracket picked correctly, up from… well, zero-ish.
Oddities and anecdotes • First trial of the tournament I ran (before looping) yielded Butler over Uconn, with Kentucky and Kansas in the final 4. • Defeated teams sometimes more likely to advance: Notre Dame has a higher chance of making the championship game over Wisconsin, 8.47% over 8.38%, but Wisconsin is more likely to win the championship, 4.90% over 4.76% • VCU had only a 51.5% chance of winning it’s first game, a 22% chance of advancing past Georgetown, and a 2.64% chance of advancing to the final 4.
Conclusions: RPI • Can RPI (remember RPI?) be predicted for a season using Monte-Carlo methods? • Decent yardstick, but not perfect • Since RPI is just a yardstick anyway, should work okay. • Can it be used to seed a tournament? • Difficult but yes, would need to run through 31 conference tournaments and determine an Ivy league AQ as well.
Conclusions: NCAA tournament • Can Monte-Carlo methods be used to predict the NCAA tournament? • Better predictor than me and better than a coin flip. • Good for calculating odds but not for absolute winner.