
EXAMPLE 1
E N D
Presentation Transcript
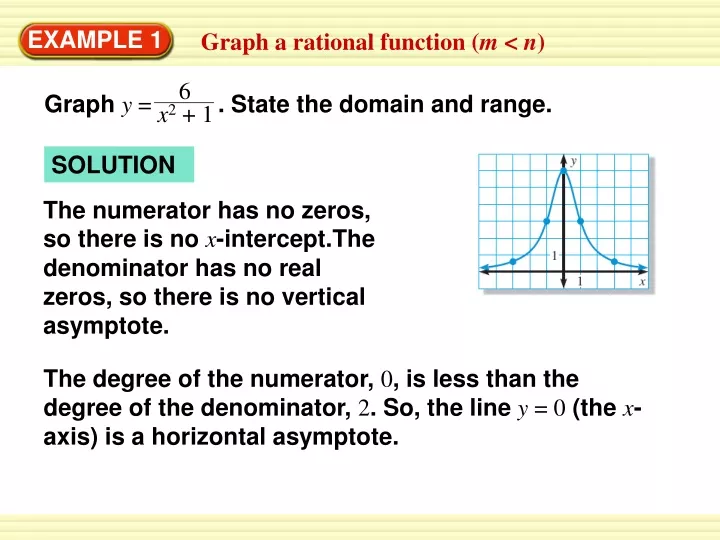
6 Graph y = . State the domain and range. x2 + 1 The numerator has no zeros, so there is no x-intercept.The denominator has no real zeros, so there is no vertical asymptote. EXAMPLE 1 Graph a rational function (m < n) SOLUTION The degree of the numerator, 0, is less than the degree of the denominator, 2. So, the line y = 0 (the x-axis) is a horizontal asymptote.
EXAMPLE 1 Graph a rational function (m < n) The graph passes through the points (–3, 0.6), (–1, 3), (0, 6), (1, 3), and (3, 0.6). The domain is all real numbers, and the range is 0 < y ≤ 6.
2x2 Graph y = . x2– 9 The numerator and denominator have the same degree, so the horizontal asymptote is y = am = = 2 bn 2 1 EXAMPLE 2 Graph a rational function (m =n) SOLUTION The zero of the numerator 2x2 is 0, so 0 is an x-intercept. The zeros of the denominator x2–9 are +3, so x = 3 and x = –3 are vertical asymptotes. Plot points between and beyond the vertical asymptotes.
EXAMPLE 2 Graph a rational function (m =n)
x2 +3x – 4 Graph y = . x – 2 EXAMPLE 3 Graph a rational function (m >n) SOLUTION The numerator factors as (x + 4)(x –1), so the x-intercepts are – 4 and 1. The zero of the denominatorx– 2 is 2, so x = 2 is a vertical asymptote. The degree of the numerator, 2, is greater than the degree of the denominator, 1,so the graph has no horizontal asymptote. The graph has the same end behavior as the graph of y = x2–1 = x. Plot points on each side of the vertical asymptote.
EXAMPLE 3 Graph a rational function (m >n)
3x2 4 x2 + 2 x2– 1 1. y = 2. y = for Example 1, 2 and 3 GUIDED PRACTICE Graph the function.
x2 – 2x – 3 x2 –5 3. f (x) = 4. y = x – 4 x2 +1 for Example 1, 2 and 3 GUIDED PRACTICE Graph the function.


