Download
1 / 1
10 likes | 83 Vues
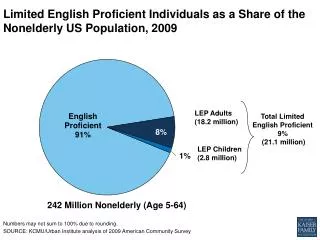
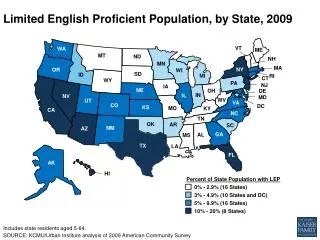
Explore the limited English proficient population percentages across different states in 2009. Analyze the distribution of LEP individuals aged 5-64. Data source: 2009 American Community Survey.

E N D
Limited English Proficient Population, by State, 2009 ME VT WA NH MT ND MN OR MA NY WI SD ID MI RI CT WY PA NJ IA NE OH DE IN IL NV MD WV CO UT VA CA DC KS MO KY NC TN OK SC AR AZ NM GA AL MS TX LA FL AK HI Percent of State Population with LEP 0% - 2.9% (16 States) 3% - 4.9% (10 States and DC) 5% - 9.9% (16 States) 10% - 20% (8 States) Includes state residents aged 5-64. SOURCE: KCMU/Urban Institute analysis of 2009 American Community Survey