Download
1 / 9
90 likes | 173 Vues
Learn how to create frequency tables and line plots to organize and visualize data sets efficiently. Practice constructing tables and plots from given data points and interpreting the results. Enhance your data analysis skills now!

E N D
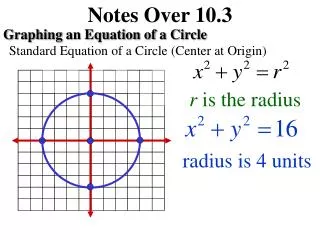
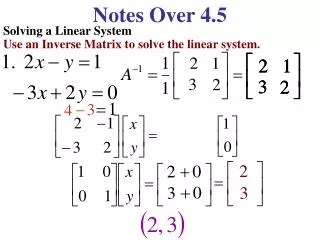
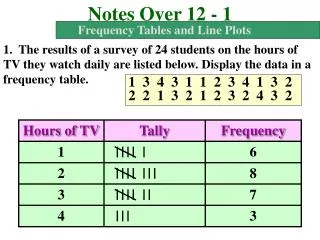
Notes Over 12 - 1 Hours of TV Tally Frequency Frequency Tables and Line Plots 1. The results of a survey of 24 students on the hours of TV they watch daily are listed below. Display the data in a frequency table. 1 3 4 3 1 1 2 3 4 1 3 2 2 2 1 3 2 1 2 3 2 4 3 2 1 6 2 8 3 7 4 3
Notes Over 12 - 1 1 2 3 4 5 6 7 8 Frequency Tables and Line Plots 2. The results of a survey of 15 students, on the number of miles from home to the mall are listed below. Display the data in a line plot. Then find the range. 2 4 3 7 3 1 4 2 2 6 3 5 1 8 3 Range - the difference between the greatest and least Range = 8 - 1 = 7
Notes Over 12 - 1 Number 10 15 20 25 30 35 40 45 Frequency Frequency Tables and Line Plots 3. Construct a frequency table from the line plot. 10 15 20 25 30 35 40 45 1 2 0 3 1 4 2 1
Pg. 610 #1-5, 6 – 23 Frequency Tables and Line Plots Display each set of data in a frequency table. 1. 1 4 0 3 0 1 3 2 2 4 DATA Tally Frequency 0 2 1 2 2 2 3 2 4 2
Pg. 610 #1-5, 6 – 23 Frequency Tables and Line Plots Display each set of data in a frequency table. 2. 6 2 8 7 9 3 5 4 8 2 4 6 4 1 DATA Tally Frequency 0 – 1 1 2 – 3 3 4 – 5 4 6 – 7 3 8 – 9 3
Pg. 610 #1-5, 6 – 23 0 1 2 3 4 Frequency Tables and Line Plots Display each set of data in a line plot. Find the range. 3. 0 2 1 1 4 0 4 3 2 Range = 4 - 0 = 4
Pg. 610 #1-5, 6 – 23 0 1 2 3 4 5 Frequency Tables and Line Plots Display each set of data in a line plot. Find the range. 4. 5 0 2 1 4 3 4 0 2 5 4 3 2 0 4 Range = 5 - 0 = 5
Pg. 610 #1-5, 6 – 23 Frequency Tables and Line Plots Describe a set of data that would be easier to display with a frequency table than with a line plot. Data obtained from items other than numbers. Example: Frequency of people with different eye color.
Pg. 610 #1-5, 6 – 23 Frequency Tables and Line Plots