Download
1 / 28
280 likes | 296 Vues
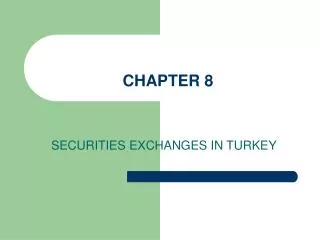
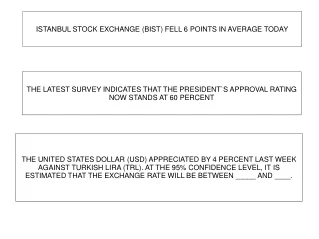
The Istanbul Stock Exchange (BIST) fell by 6 points today. The latest survey shows that the President's approval rating is now at 60%. The USD appreciated by 4% against TRL last week.

E N D
ISTANBUL STOCK EXCHANGE (BIST) FELL 6 POINTS IN AVERAGE TODAY THE LATEST SURVEY INDICATES THAT THE PRESIDENT`S APPROVAL RATING NOW STANDS AT 60 PERCENT THE UNITED STATES DOLLAR (USD) APPRECIATED BY 4 PERCENT LAST WEEK AGAINST TURKISH LIRA (TRL). AT THE 95% CONFIDENCE LEVEL, IT IS ESTIMATED THAT THE EXCHANGE RATE WILL BE BETWEEN _____ AND ____.
THE PRICE OF KOC HOLDING STOCK WILL BE HIGHER IN SIX MONTH THAN IT IS NOW THE PRICE OF KOC HOLDING STOCK IS LIKELY TO BE HIGHER IN SIX MONTH THAN IT IS NOW
THE STAGES FOR STATISTICAL THINKING ARE: 1- DEFINE THE PROBLEM 2- DETERMINE WHAT DATA IS NEEDED 3- SELECT A SAMPLE 4- COLLECT DATA 5- SUMMARIZE AND ANALYZE DATA 6- MAKE INFERENCES AND DECISIONS BASED ON INFORMATION
The Journey to Making Decisions Begin Here: Identify the Problem DATA DATA Descriptive Statistics, Probability, Computers INFORMATION Experience, Theory, Literature Inferential Statistics, Computers KNOWLEDGE DECISION MAKING
DATA: Specific observations of measured numbers. INFORMATION: Processed and summarized data yielding facts and ideas. KNOWLEDGE: Selected and organized information that provides understanding, recommendations, and the basis for decisions.
Descriptive Statistics include graphical and numerical procedures that summarize and process data and are used to transform data into information Descriptive Statistics include graphical and numerical procedures that summarize and process data and are used to transform data into information Descriptive Statistics include graphical and numerical procedures that summarize and process data and are used to transform data into information Descriptive Statistics include graphical and numerical procedures that summarize and process data and are used to transform data into information Inferential Statistics provide the bases for predictions, forecasts, and estimates that are to transform information to knowledge
POPULATION: A complete set of individuals, objects or measurements having common observable characteristics. Examples of Populations - Names of all registered voters in TURKEY - Incomes of all families living in ANKARA - Annual return of all stocks traded on the ISTANBUL STOCK EXCHANGE - Grade Point Averages of all the students in your University - BILKENT
SAMPLE: A subset or part of a population Examples of Samples - Names of 50.000 registered voters in TURKEY - Incomes of 10.000 families living in ANKARA - Annual return of 150 stocks traded on the ISTANBUL STOCK EXCHANGE - Grade Point Averages of 500 students from different departments in your University - BILKENT
Example: Imagine that a public opinion polling firm has been contracted to conduct a study concerning the percentage of the state`s registered voters who approve of nuclear power as an energy source. As part of the polling process, 750 individuals are randomly selected from the voter registration list and carefully interviewed. Elements? Random Sample ? Variable of Interest? Data? Statistic? Population?
Frequency Distribution • Example: Marada Inn Above Average Above Average Below Average Poor Above Average Average Below Average Above Average Above Average Average Above Average Average Above Average Average Above Average Below Average Poor Excellent Above Average Average
Frequency Distribution • Example: Hudson Auto Repair Sample of Parts Cost($) for 50 Tune-ups
Dot Plot • Example: Hudson Auto Repair Tune-up Parts Cost 5060708090100110 Cost ($)
Stem-and-Leaf Display • Example: Hudson Auto Repair 5 6 7 8 9 10 2 7 2 2 2 2 5 6 7 8 8 8 9 9 9 1 1 2 2 3 4 4 5 5 5 6 7 8 9 9 9 0 0 2 3 5 8 9 1 3 7 7 7 8 9 1 4 5 5 9 a stem a leaf
525 530 530 535 535 535 535 535 540 540 540 540 540 545 545 545 545 545 550 550 550 550 550 550 550 560 560 560 565 565 565 570 570 572 575 575 575 580 580 580 580 585 590 590 590 600 600 600 600 610 610 615 625 625 625 635 649 650 670 670 675 675 680 690 700 700 700 700 715 715 Note: Data is in ascending order.
Measures of Location • Mean • Weighted Mean • Median • Mode • Percentiles • Quartiles
Sample Mean Sum of the values of the n observations Number of observations in the sample
Population Mean m Sum of the values of the N observations Number of observations in the population
Weighted Mean If data is from a population, m replaces x. Numerator: sum of the weighted data values Denominator: sum of the weights where: xi= value of observation i wi= weight for observation i
Weighted Mean • Example: Construction Wages Ron Butler, a home builder, is looking over the expenses he incurred for a house he just built. For the purpose of pricing future projects, he would like to know the average wage ($/hour) he paid the workers he employed. Listed below are the categories of worker he employed, along with their respective wage and total hours worked. Ron Butler, a custom home builder, is looking over the Expenses he incurred for a house he just completed constructing. For the purpose of pricing future projects, he would like to know the average wage ($/hour) he paid the workers he employed. (The cost of materials is estimated in advance by the architect.) Listed below are the categories of worker he employed, along with their respective wage and total hours worked.
Weighted Mean • Example: Construction Wages FYI, equally-weighted (simple) mean = $21.21
80th Percentile • Example: Apartment Rents i = (p/100)n = (80/100)70 = 56 Averaging the 56th and 57th data values: 525 530 530 535 535 535 535 535 540 540 80th Percentile = (635 + 649)/2 = 642 540 540 540 545 545 545 545 545 550 550 550 550 550 550 550 560 560 560 565 565 565 570 570 572 575 575 575 580 580 580 580 585 590 590 590 600 600 600 600 610 610 615 625 625 625 635 649 650 670 670 675 675 680 690 700 700 700 700 715 715 Note: Data is in ascending order.
80th Percentile • Example: Apartment Rents “At least 80% of the items take on a value of 642 or less.” “At least 20% of the items take on a value of 642 or more.” 525 530 530 535 535 535 535 535 540 540 540 540 540 545 545 545 545 545 550 550 56/70 = .8 or 80% 14/70 = .2 or 20% 550 550 550 550 550 560 560 560 565 565 565 570 570 572 575 575 575 580 580 580 580 585 590 590 590 600 600 600 600 610 610 615 625 625 625 635 649 650 670 670 675 675 680 690 700 700 700 700 715 715
Quartiles • Quartiles are specific percentiles. • First Quartile = 25th Percentile • Second Quartile = 50th Percentile = Median • Third Quartile = 75th Percentile
A wholesaler sold 575, 410 and 520 microwave ovens at prices (in USD) 75, 125 and 100 respectively. What is the mean price of the ovens sold?
Example: The following data represent the duration (in days) of Space Shuttle voyages for the years 1992-1994. (18 values) 8,9,9,14,8,8,10,7,6,9,7,8,10,14,11,8,14,11 Q: Find The Mode
MONTHLY STARTING SALARY (In TRL) TOTAL: 35,280