Download
1 / 2
20 likes | 112 Vues
Explore the finalized calculation of heliospheric brightness using SMEI data, focusing on the zodiacal-light model over a nine-year period. The study includes analyzing residue maps and adjusting for CCD response loss.

E N D
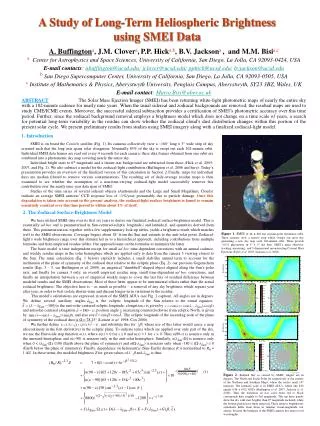
A Study of Long-Term Heliospheric Brightness using SMEI Data 1. Introduction SMEI is on board the Coriolis satellite (Fig. 1). Its cameras collectively view a ~160° long × 3° wide strip of sky oriented such that the long axis spans solar elongation. Nominally 85% of the sky is swept out each 102-minute orbit. Individual SMEI data frames are read out every 4 seconds for each camera; these data frames obtained from one orbit are combined into a photometric sky map covering nearly the entire sky. Individual bright stars to 6th magnitude and a fainter-star background are subtracted from these (Hick et al. 2005; 2007, and Fig. 2). We also subtract a model for the zodiacal-light contribution (Buffington et al. 2006 and here). Today’s presentation provides an overview of the finalized version of this calculation in Section 2.Finally, maps for individual days are median filtered to remove various contaminations. The resulting set of daily-average residue maps is then examined to see whether the assumption of a non-time-varying zodiacal-light model successfully removes this contribution over the nearly nine-year data span of SMEI. Studies of the time series of several sidereal objects (Andromeda and the Large and Small Magellanic Clouds) indicate an average SMEI cameras’ CCD response loss of ~1%/year, presumably due to particle damage. Once this degradation is taken into account in the present analysis, the zodiacal-light surface brightness is found to remain essentially constant over this time period to within about 1% of itself. 2. The Zodiacal Surface-Brightness Model We have utilized SMEI data over its first six years to derive our finalized zodiacal surface-brightness model. This is essentially ad hoc and is parameterized in Sun-centered-ecliptic longitudeλand latitude, and quantities derived from these. This parameterization, together with a few supplementary look-up tables, yields a brightness result which matches well to the SMEI observations. Coverage begins about 18° from the Sun and extends to the anti-solar point. Zodiacal-light’s wide brightness range over this domain led us to a hierarchical approach, including contributions from multiple formulae and from empirical residue tables. Our approach leans on the formulae to minimize the latter. The basic model is time independent except for small ad hoc time-dependent corrections with an annual cadence, and weekly residue maps in the solar hemisphere which are applied only to data from the camera 3 viewing closest to the Sun. The main calculation (Eq. 1 below) explicitly includes a small slab-like annual term to account for the inclination of the plane of symmetry of the zodiacal dust relative to the ecliptic plane (Eq. 2), our previous Gegenschein results (Eqs. 3 – 5, see Buffington et al. 2009), an empirical “dumbbell”-shaped object aligned along the Sun’s polar axis, and finally for camera 3 only, an overall empirical residue map, small time-dependent ad hoc corrections, and finally an interpolation between a set of empirical weekly maps to cover the last bits of residual difference between modeled results and the SMEI observations. Most of these latter appear to be instrumental effects rather than the actual zodiacal brightness. The objective here is – as much as possible – a removal of any sky brightness which repeats year after year, in order to best isolate shorter-term and discern longer-term variations in the residue. This model’s calculations are expressed in units of the SMEI ADUs (see Fig. 2 caption). All angles are in degrees. We define several auxiliary angles: λSun is the ecliptic longitude of the Sun relative to the vernal equinox; is the anti-solar-centered ecliptic longitude; elongation ε is given by and antisolar-centered elongation ; position angle γ, increasing counterclockwise from ecliptic North, is given by , and also . The ecliptic longitude of the ascending node of the plane of symmetry of the zodiacal dust is Ω = 78.25° (Leinert et al. 1998; Cox 2000). We further define , and substitute this for where use of this latter would cause a cusp (discontinuity in the first derivative) in the ecliptic plane. To indicate terms which are applied over only part of the sky, we use the Heaviside step function u(x), where u(x) = 0 for x ≤ 0 and u(x)= 1 for x > 0. Thus u(90-ε) is nonzero only in the sunward hemisphere and u(ε-90) is nonzero only in the anti-solar hemisphere. Similarly, u(λSun-Ω) is nonzero only when 0 < (λSun-Ω) ≤180 (Earth above the plane of symmetry) and u(Ω-λSun) is nonzero only when -180 ≤ (Ω-λSun) ≤ 0 (Earth below the plane of symmetry). Finally, dependence on heliocentric (Sun–Earth) distance R is normalized to R0 = 1 AU. In these terms, the modeled brightness Z for given values of λ , and λSun is thus: (1) A. Buffingtona, J.M. Clovera,P.P. Hicka,b,B.V. Jacksona, and M.M. Bisia,c aCenter for Astrophysics and Space Sciences, University of California, San Diego, La Jolla, CA 92093-0424, USA E-mail contacts: abuffington@ucsd.edu; jclover@ucsd.edu; pphick@ucsd.edu; bvjackson@ucsd.edu bSan Diego Supercomputer Center, University of California, San Diego, La Jolla, CA 92093-0505, USA cInstitute of Mathematics & Physics, Aberystwyth University, Penglais Campus, Aberystwyth, SY23 3BZ, Wales, UK E-mail contact: Mario.Bisi@aber.ac.uk ABSTRACTThe Solar Mass Ejection Imager (SMEI) has been returning white-light photometric maps of nearly the entire sky with a 102-minute cadence for nearly nine years. When the usual sidereal and zodiacal backgrounds are removed, the residual maps are used to study CME/ICME events. Moreover, the successful sidereal subtraction provides a certification of SMEI’s photometric accuracy over this time period. Further, since the zodiacal background removal employs a brightness model which does not change on a time scale of years, a search for potential long-term variability in the residue can show whether the zodiacal cloud’s dust distribution changes within this portion of the present solar cycle. We present preliminary results from studies using SMEI imagery along with a finalized zodiacal-light model. Figure 1. SMEI is in a 840 km circular-polar terminator orbit. Three cameras view a narrow strip which sweeps out most sky, generating a new sky map each 102-minute orbit. These provide ~0.1% photometry in 1º × 1º sky bins. SMEI’s main objective: tracking, measuring, and 3-dimensional reconstructing Coronal Mass Ejections (Eyles et al. 2003; Jackson et al. 2004). Figure 2.Sidereal Sky as viewed by SMEI. Angles are in degrees. The North and South Poles lie respectively at the centers of the Northern and Southern Maps, where the circles mark 10° intervals. The intensity scale is in SMEI ADUs, where one S10 equals 0.46 ± 0.02 ADUs (Buffington et al. 2007; Jackson et al. 2010). Thus the transition in star color from red to black corresponds here roughly to 3rd magnitude. The top three panels show the sky with stars brighter than 6th magnitude included, while the bottom panels have these removed. These relative brightnesses sometimes differ from those in familiar visual-magnitude star atlases, because the bandpass of the SMEI cameras lies more to red wavelengths.
The term provides a slabwhose maximum brightness is 6 ADUs. This moves back and forth between North and South over the course of a year, is brighter in the South than the North, and is placed above or below the ecliptic and also “feathered” across it, over ± 5°. Here, (2) An empirical dumbbell-shaped incorporates as much as possible of what’s left into an analytic formula, and the stubborn final-residual terms E and F(λSun) are maps for the towards-the-Sun hemisphere whose proper look-up-table entries are determined by λ-λSun and . These details will be described in an article currently in preparation. Finally, the term explicitly includes the “Gegenschein enhancement” (Buffington et al. 2009) with (3) where (4) (5) In the anti-solar hemisphere these equations are essentially unchanged from those in our earlier Gegenschein article (Buffington et al. 2009). Here, the addition of the final term in Eq. (3), the curly brackets, smoothly decreases the Gegenschein enhancement contribution for , so as to render it negligible in the Sunward hemisphere; the inclusion of in this previous article’s figure 4 would have rendered it a bit more round, a slightly better match to the data in that same article’s figure 2. A representative result with the present model is shown here in Fig. 3. An average over the year is presented in Fig. 4. To search for possible evolution of the actual zodiacal-cloud surface brightness away from this model over the nearly nine-year data span of SMEI, we average the residue maps over quarterly time periods for each year and show the result in Fig. 5. As said above, this is a report of work in progress, so this figure presently includes only surface brightness residues from cameras 1 and 2. We’re still working to provide the optimum performance for camera 3, the one which looks closest to the Sun. Cameras 1 and 2 cover the sky from typically 50º of the Sun to anti-solar. Inclusion of Camera 3 covers to about 20º of the Sun. In Fig. 5 over the course of a year, the Sun moves from right to left along a roughly sinusoidal path, passing through any given panel’s center at the Vernal Equinox. Fig. 5 demonstrates the success of removing the sidereal background contribution over the time span of SMEI (the instrument was stowed and data have stopped since September of this year). A ghostly residue of the Milky Way’s disk can be seen in some of the panels, but having a surface brightness of at most only a few ADUs, and usually less than one. This compares with a typical brightness along the disk of hundreds of ADUs (Fig. 2). Blue spots here are the residue of the removal of the bright planets; these mark the ecliptic-plane location. Otherwise, little evolution is seen in these panels, perhaps a small progression from blue (excess brightness) at the top, to red (deficit brightness) at the bottom, particularly in the North. However, this is only a few ADUs over the nine years, it shows slight but comparable disagreements where cameras 1 and 2 join, and it bears little resemblance to the zodiacal-brightness distributions of Figs. 3 and 4 presented here. If our continued analysis, and especially when adding results from Camera 3, indicates that this is not an instrumental effect, this could indicate that an amount of the slab contribution, Eq (2) above, indeed might change in this time. However, the amount of such change would be small compared with the total zodiacal signal. Figure 3. Modeled result evaluated for the beginning of January. Here the Sun is located in the middle of the large black spot at R.A. = 18.5 hours and Declination = -23º. The Gegenschein is the small yellow spot, on the opposite side of the celestial sphere, at 6.5 hours and +23º. Figure 4.Modeled results are averaged over a year, North and South are averaged, and presented in Sun-centered ecliptic coordinates. The ADUs in this figure alone have been divided by 0.46 to convert to S10 units. Although SMEI coverage sometimes extends to within 18° of the Sun, we here limit the presented result to >20°. 3. Summary and Conclusion We are progressing well toward our goal of a complete analysis of the SMEI data, and have achieved a photometric removal of the sidereal-sky background better than 1%. We have developed an empirical zodiacal surface-brightness model which fits the observations well, and when removed leaves only the small residue seen in Fig. 5 over the nearly nine-year data span of SMEI. This result indicates that the zodiacal-dust distribution probably has remained essentially unchanged during this time. The sidereal-sky removal and empirical zodiacal model that we have developed (although the latter is burdened with many parameters and several lookup tables) should prove useful techniques for analysis of data from present and future wide-angle broadband heliospheric imagers: these preserve the original differential-photometry precision of individual sky maps, and remove the need for subtracting one skymap image from another (“difference image processing”) in order to detect and, especially, quantitatively analyze the relatively small brightness changes that characterize coronal mass ejections and other interesting transient events. This work has been supported in part by grants NSF AGS-1053766 and NASA NNX11AB50G. Figure 5. Residual surface brightness when individual stars and residual sidereal background are subtracted, and when the zodiacal surface-brightness model presented here is also removed. Nearly nine years of SMEI data are presented, here averaged into 3-month intervals. REFERENCES Buffington, A., Jackson, B.V., Hick, P., Price, S.D., 2006. An Empirical Description of Zodiacal Light as Measured by SMEI. EOS Trans. AGU 87(52), Fall Meeting Suppl., Abstract, SH32A-06. Buffington, A., Bisi, M.M., Clover, J.M., Hick, P.P., Jackson, B.V., Kuchar, T.A., and Price, S.D., 2009. Measurements of the Gegenschein brightness from the Solar Mass Ejection Imager (SMEI). Icarus203, 124−133, doi:10.1016/j.icarus.2009.04.007. Cox, A.N.: 2000, ‘Allen’s Astrophysical Quantities, fourth edition’, New York. Eyles, C.J., et al., 2003. The Solar Mass Ejection Imager (SMEI). Solar Phys. 217, 319. Hick, P.P., Buffington, A., Jackson, B.V., 2005. The SMEI real-time data pipeline: From raw CCD frames to photometrically accurate full-sky maps. Proc. of SPIE 59011B, doi: 10.1117/12.617996. Hick, P.P., Buffington, A., Jackson, B.V., 2007. A Procedure for Fitting Point Sources in SMEI White-Light Full-Sky Maps. Proc. of SPIE 66890C 1−8, doi: 10.1117/12.734808. Jackson, B.V., et al., 2004. The Solar Mass Ejection Imager (SMEI) Mission. Solar Phys. 225, 177-207. Jackson, B.V., Buffington, A., Hick, P.P., Bisi, M.M., and Clover, J.M., 2010. A heliospheric imager for deep space: lessons learned from HELIOS, SMEI, and STEREO. Solar Phys. 265, 257-275, doi: 10.1007/s11207-010-9579-3. Leinert, Ch., et al., 1998. The 1997 reference of diffuse night sky brightness. Astron. Astrophys. Supp. Ser. 127, 1-99.