Download
1 / 8
100 likes | 458 Vues
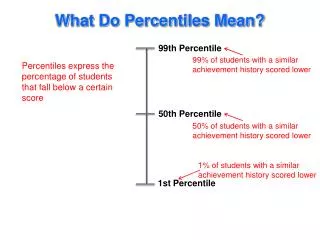
What Do Percentiles Mean?. 99th Percentile. 99% of students with a similar achievement history scored lower. Percentiles express the percentage of students that fall below a certain score. 50th Percentile. 50% of students with a similar achievement history scored lower.

E N D
What Do Percentiles Mean? 99th Percentile 99% of students with a similar achievement history scored lower Percentiles express the percentage of students that fall below a certain score 50th Percentile 50% of students with a similar achievement history scored lower 1% of students with a similar achievement history scored lower 1st Percentile
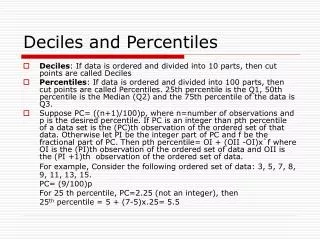
Student Growth Percentile Characteristics • Percentiles express the percentage of cases that fall below a certain score. • SGPs are reported between 1 and 99. • Higher numbers represent higher growth and lower numbers represent lower growth. • Uncorrelated with prior achievement • Low achieving students can show high growth. • High achieving students can show low growth.
Can students who perform at high levels have a negative achievement result? Lower than expected growth 400 350 300 250 200 Student A YES Student B Prior Score 3 years Prior Score 2 years Prior Score 1 year Current Score this year A student whose score drops from one year to the next could demonstrate moderate to high growth depending on the overall performance of the cohort.
Can students who perform at low levels have a positive achievement result? 400 350 300 250 200 Student A YES Higher than expected growth Student B Prior Score 3 years Prior Score 2 years Prior Score 1 year Current Score this year A student whose score drops from one year to the next could demonstrate moderate to high growth depending on the overall performance of the cohort.
Three Students with the Same SOL Scaled Scores on Grade 6 Reading
Same Three Students - in Grade 7:SOL Scores Example only. Note that SGPs account for as much historical data as are available.
Same Three Students - in Grade 7:SGP Calculations SGP = 18 SGP=48 SGP=61 Example only. Note that SGPs account for as much historical data as are available.
Student Growth PercentileLevels To help interpret Student Growth Percentiles, the Virginia Department of Education established categorical growth levels of low, moderate, and high. These data will be reported with the growth data for your division or school. Low growth: represents students with SGPs of 1 to 34. Moderate growth: includes students with SGPs of 35 to 65. High growth: represents students with SGPs of 66 to 99.