Download
1 / 31
310 likes | 472 Vues
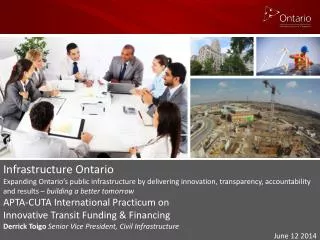
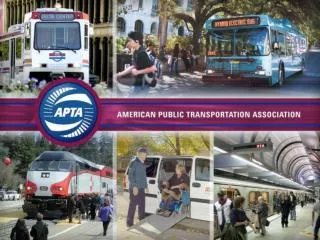
What is APTA?. Public transportation sector organization based in United States, with 1,500 transit, business, and other members worldwide. Began in 1882 - the era of horse-drawn street railway cars. Arthur Guzzetti Vice President - Policy. American Public Transportation Association

E N D
What is APTA? • Public transportation sector organization based in United States, with 1,500 transit, business, and other members worldwide. • Began in 1882 - the era of horse-drawn street railway cars.
Arthur GuzzettiVice President - Policy American Public Transportation Association aguzzetti@apta.com
Public Transportation in the U.S. • 35 million times every weekday, people board public transportation. • Ridership at record levels: above 10 billion annual trips for five consecutive years. • Approximately 7,700 transit providers in U.S., but 70% of usage on top 30 systems.
Public Transportation in the U.S. • 53% of trips taken on buses. • 42% of trips taken on rail. • 5% on other modes. • $48 billion industry; employs more than 380,000 people and supports 1.7 million jobs.
High-Speed Rail: Coming to America! • Hundreds of thousands of American jobs • Economic development power to be unleashed through building new stations in the heart of cities. • Helps fill need to complete our national transportation system in ways consistent with energy, environment, population and economic goals.
Shifting Transportation Focus…. Bush Administration: • Road Tolling • Congestion Pricing • Pubic-Private Partnerships Obama Administration: • Livability • Greenhouse Gases • Clean-Energy Jobs • Env. Justice/Equity
TransitVision 2050 Trends Population Social and Demographic Economic Energy and Environment Ridership Public Choice and Acceptance Affordability
Our National Transportation Policy… 20th Century – Interstate Roads 21st Century – Better choices, priming the pumps of our economic engines
Overall Results Pre-November Elections Wins: 21 Losses: 5 Total: 26 Success Rate: 81% Election Day Wins: 23 Losses: 8 Total: 31 Success Rate: 74% 2010 Wins: 44 Losses: 13 Total: 57 Success Rate: 77%
Transit Decreases Dependence on Foreign Fuel; Conserves Energy • Households near public transit drive an average of 4,400 fewer miles annually • Saves 4.2 billion gallons of gasoline annually • Reduces CO2 emissions by 37 million metric tons annually Oil Consumption Drops
White House Conference on AgingDecember 2005 Top 5 Resolutions (of 73 presented) Older Americans Act Long Term Care Transportation Options Medicaid Medicare
APTA Reports – White House Conference on Aging Expanding Mobility Options for Older Adults: Community Design Incentives Mobility Options that will Enable Freedom, Opportunity and Independence for Older Adults: A Vision for Our Transportation Future Aging Americans: Stranded Without Options
Objectives ►Identify actions and services needed to expand mobility options for older people ►Quantify demand for these public transportation services ►Estimate the funding that will be needed to provide them
Services and Actions The Big Picture ►Fixed-route operations and planning ► Vehicles ► Help for older people to use existing services ► Supplementary services ► Universal design at transit facilities, streets, and sidewalks
Services and Actions Quantifiable Services and Actions ► ADA Paratransit ► Dial-a-Ride ► Taxi Subsidy ► Volunteer Drivers ► Community Buses ► Outreach and Training ► Information and Assistance ► Driver Training
Existing Funding Gap ►Estimated cost of $4.8 billion for needed services in 2010 (capital + operating) ►About one-half of this is now being provided by transit agencies and community organizations
Not Included in the National Estimates ► Changes or increases to conventional transit service ► Modifications to transit vehicles ► Improvements at bus stops (accessible pathways, benches, and shelters) ► Improvements to pedestrian facilities near transit stops (sidewalks, crosswalk improvements) ►Planning and interagency coordination
Pedestrian Improvements Discussion and Unit Costs: ►Medians and pedestrian refuges ► Curb extensions ► Crossing signals: longer timing, audible, larger ► Sidewalks, lighting, curb ramps ► Benches and bus shelters
Arthur Guzzetti aguzzetti@apta.com American Public Transportation Association www.apta.com