Mastering Square Root Functions - Graphs and Transformations
Learn about square root functions, graphing examples, transformations, domains, ranges, and inequalities with step-by-step guidance and quizzes.

Mastering Square Root Functions - Graphs and Transformations
E N D
Presentation Transcript
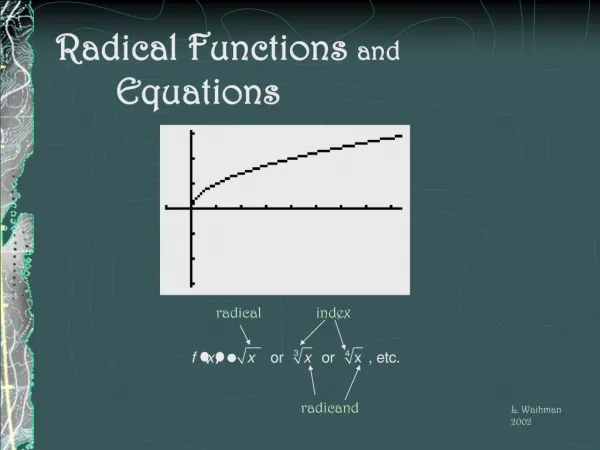
SQUARE ROOT Functions Radical functions 8-7: Square Root Graphs
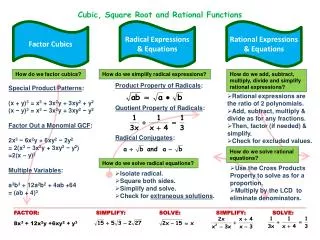
Review A radical function is a function whose rule is a radical expression, which include the square-root function, 8-7: Square Root Graphs
EXAMPLE 1 Graph each function and identify its domain and range of g(x) Range: Domain: 8-7: Square Root Graphs
EXAMPLE 2 Graph each function and identify its domain and range of Range: Domain: 8-7: Square Root Graphs
EXAMPLE 3 Using the graph, f(x) = , as a guide, describe the transformation, identify the domain and range, and graph the function, Domain: g(x) Range: g(x) translates 4 units right 8-7: Square Root Graphs
EXAMPLE 4 Using the parent function as a guide, describe thetransformation, identify the domain and range, and graph the function, Domain: Range: g(x) g(x) translates 4 units down 8-7: Square Root Graphs
Your Turn Using the parent function as a guide, describe the transformation, identify the domain and range, and graph the function, Range: Domain: g(x) g(x) translates 5 units left and 5 units down 8-7: Square Root Graphs
Your Turn Graph each function and identify its domain and range of Domain: Range: g(x) translates 1 unit right, 3 units up and stretches by a factor of 2 8-7: Square Root Graphs
• • Example 3: Applying Multiple Transformations Using the graph of as a guide, describe the transformation and graph the function f(x)= x . Reflect f across the x-axis, and translate it 4 units to the right.
• • Lesson Quiz: Part II Using the graph of as a guide, describe the transformation and graph the function . g(x) = -x + 3 g is f reflected across the y-axis and translated 3 units up.
g(x) = –3 x – 1 ● ● Check It Out! Example 3b Using the graph of as a guide, describe the transformation and graph the function. f(x)= x g is f vertically stretched by a factor of 3, reflected across the x-axis, and translated 1 unit down.
1 5 Example 4: Writing Transformed Square-Root Functions Use the description to write the square-root function g. The parent function is reflected across the x-axis, compressed vertically by a factor of , and translated down 5 units. f(x)= x
Check It Out! Example 4 Use the description to write the square-root function g. The parent function is reflected across the x-axis, stretched vertically by a factor of 2, and translated 1 unit up. f(x)= x
Step 1 Use the related equation to make a table of values. y =2 x -3 Example 6: Graphing Radical Inequalities Graph the inequality .
Example 6 Continued Step 2 Use the table to graph the boundary curve. The inequality sign is >, so use a dashed curve and shade the area above it. Because the value of x cannot be negative, do not shade left of the y-axis.
Example 6 Continued Check Choose a point in the solution region, such as (1, 0), and test it in the inequality. 0 > 2(1) – 3 0 > –1
Step 1 Use the related equation to make a table of values. y = x+4 Check It Out! Example 6a Graph the inequality.
Check It Out! Example 6a Continued Step 2 Use the table to graph the boundary curve. The inequality sign is >, so use a dashed curve and shade the area above it. Because the value of x cannot be less than –4, do not shade left of –4.
Check It Out! Example 6a Continued Check Choose a point in the solution region, such as (0, 4), and test it in the inequality. 4 > (0) + 4 4 > 2
Step 1 Use the related equation to make a table of values. y = x - 3 3 Check It Out! Example 6b Graph the inequality.
Check It Out! Example 6b Continued Step 2 Use the table to graph the boundary curve. The inequality sign is >, so use a dashed curve and shade the area above it.
Check It Out! Example 6b Continued Check Choose a point in the solution region, such as (4, 2), and test it in the inequality. 2 ≥ 1
1. Graph the function and identify its range and domain. • Lesson Quiz: Part I D:{x|x≥ –4}; R:{y|y≥ 0}
• • Lesson Quiz: Part II 2. Using the graph of as a guide, describe the transformation and graph the function . g(x) = -x + 3 g is f reflected across the y-axis and translated 3 units up.
Lesson Quiz: Part III 3. Graph the inequality .