Bus Transport Sector in the Philippines
240 likes | 627 Vues
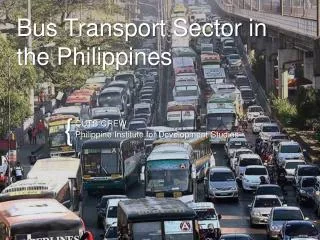
Bus Transport Sector in the Philippines. CUTS-CREW Philippine Institute for Development Studies. Selected Statistics, Philippines. Public transportation in the Philippines. Gross Value Added in Transportation, 2008-2012 (million pesos, 2000 prices) Source: NSCB, PSY 2013.

Bus Transport Sector in the Philippines
E N D
Presentation Transcript
Bus Transport Sector in the Philippines CUTS-CREW Philippine Institute for Development Studies
Gross Value Added in Transportation, 2008-2012 (million pesos, 2000 prices)Source: NSCB, PSY 2013
Percentage of Motor Vehicles, by Type (2008-2013) Source: LTO, NSCB PSY 2013
Number of PUBs traversing Metro Manila (2008-2012) Source: MMDA
What is the state of competition in the bus transport sector? • What is the regulatory and institutional framework governing bus transport? How do they impact competition in the market? • What competition reforms have been implemented? How did the reforms affect: • the market structure? • the welfare of consumers and producers? Research Questions
Bus transportation – governed by the DOTC through its line agencies (LTFRB, LTO) • LTFRB – regulation of entry & exit, bus fares • LTO – implementation of LTFRB & other transport policies • MMDA, PNP, LGUs – other agencies involved in implementation of traffic laws & transport regulations • NEDA, DPWH – involved in planning and development of road infrastructure & development policies • Regulatory framework – complicated regime where regulation and enforcement is shared by several agencies Regulatory Framework in Bus Transport
DOTC Department Order No. 92-587 (1992) • Provided the framework for liberalization reform in transportation includingentry & exit, route-setting mechanisms, and fare regulation & adjustment procedures • Reforms imposing moratorium on issuance of new franchises or certificate of public conveyance (CPCs) • Moratorium on issuance of CPCs for provincial buses (2000) • MC 2003-028- nationwide moratorium on new CPCs (2003) Reforms in bus transport
Number of operators and buses, Manila Routes Analysis of Policy Reform
The bus transport sector evolved from a highly regulated and concentrated market in the 1970s to a liberalized market composed primarily of small operators • The market operates under a highly complicated regime where regulation and enforcement is shared by several agencies resulting to implementation failures & regulatory capture • Operation of illegal (“colorum”) buses • Proliferation of “kabit” system where a bus owner enters the market through arrangement with an operator with established franchise • Market inefficiency manifests in too many operators and buses resulting to traffic congestion Findings
Herfindahl-Hirschman Index (HHI) • , where si is the market share of firm iin the route, and N is the number of bus operators. The higher the HHI is compared to 1/N, the less competitive is the bus market in the route • Suggested classification: • Substantial competition: • Mild competition: 1.4< Market Structure Indicator
Secondary Data • Price data, fare changes • Time series data on market structure • Data on substitute modes of transportation (MRT, LRT fares, ridership & cost of operation) • Primary Data • CUTS-CREW matrix Next Steps: Data for Further Analysis