
Unlocking Business Insight: iBi Visualizer for Enhanced Data Intelligence
iBi Visualizer empowers users to navigate complex data effortlessly, enabling them to uncover critical insights and make informed decisions in real-time. With its intuitive interface, iBi transcends traditional data barriers, allowing authorized users, including administrators and auditors, to manipulate views seamlessly. This comprehensive business intelligence tool integrates with existing applications, providing graphical representation and advanced analysis without the need for extensive data preparation. By isolating key data points, iBi helps users spot irregularities and trends, ensuring that critical information is readily accessible.

Unlocking Business Insight: iBi Visualizer for Enhanced Data Intelligence
E N D
Presentation Transcript
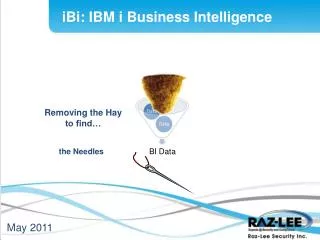
iBi: IBM i Business Intelligence Removing the Hay to find… the Needles BI Data May 2011
iBi: IBM i Business Intelligence • Graphically isolates the "needle in the haystack“ when investigating: • Security breaches • System activities • Irregular application-related activities iBiuses filters to process large quantities of transaction data BIData May 2011 2
iBi – Broadening Your Imagination iBi Imagine working on your standard AS/400 application and selecting: And exporting your information as a Business Intelligence report or Excel Function key from your green screen OR Icon from the application GUI
What is iBi? iBi is an application add-on that enables GUI or green-screen application users to view and analyze the information they deal with, in immediate extended views including: Graphical summarized BI tools Excel spreadsheet
How iBi is used? • The data displayed by iBi (“View”) is limited to the subject • that is being presently handled by each individual user • Views can be kept for reuse • iBi can also be used to create views which • are later accessed by applications, • DB maintenance personal, system • administrators etc. No programming or preparation is required
iBi-Visualizer • IBI is affordable, server-based pricing as opposed to user-based • iBI is a comprehensive Business Intelligence tool that is intended to be integrated into user applications (green-screen or GUI) • iBI graphically provides an in-depth understanding of the businessitem under consideration • iBI requires no special data preparation – it runs on your current data
iBi-Visualizer User Scenario Select the filter values to define your BI investigation • Click on any of the dimension tabs to see more info • Drilldown is just a click away • Select dimension-based conditions to add to the filter • Click any dimension tab to summarize the related information in accordance with the filter conditions
iBi-Visualizer • Restricts the user to the subject they are currently working on, e.g. Order, Customer, Account, iSecurity Audit and Firewall data… • iBi enables users to create views based upon exactly what they are authorized to see. • Users can effortlessly "slice and dice" data into graphical charts for Business Intelligence analysis.
What is iBi-Visualizer? • iBi-Visualizer uses the advanced analysis and statistics capabilities of Visualizer to display the views created by iBi. • This is an interactive process in which the views can be adjusted and tweaked as needed.
What is iBi-Visualizer? • Working with iBi-Visualizer enables creating temporary views until satisfactory results are achieved and saved (you found the “needle in the haystack”)
The Value of iBI • The user simply clicks • on a dimension to • Re-"VIEW“ an updated view of the data • iBi makes investigations a snap • iBi empowers your users, helping them make better customer facing real time decisions
The iBi Customer… iBi is intended for anyone who is authorized to view and analyze sensitive data for investigative purposes. Typical users are: • Database administrators • Data warehouse personnel • Administrators • Auditors
How iBi connects to user applications BI Data • In this product tutorial we will demonstrate the use of iBi to create a restricted view of data for an end user, using a FileScope application and analyzing it using iBi-Visualizer • As previously mentioned, iBi can be accessed either from a GUI environment or via the green-screen command line
Default view of a logical file (statistical summary information) based on the original file
Defining which fields (dimensions) to display in iBi, and the order of the fields, in order to create a restricted view for the end user
A view of a modified file with user friendly field (dimension) titles
Define a green-screen filter to create a restricted view of the file
A filtered view of the file displaying the visits to the “Auditorium” only
AS400 application opening iBi-Visualizer Lightening Fast
iBi-Visualizer • Eliminates the need for time & resource consuming implementation of the full data warehouse • Affordable licensing - unlike other BI tools • Data can be exported directly to Excel, HTML, CSV,…
Thank You! Please visit us at www.razlee.com 27