Download
1 / 21
210 likes | 366 Vues
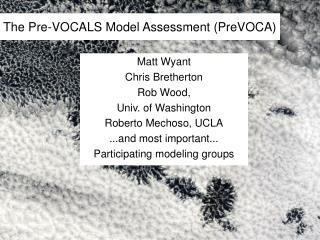
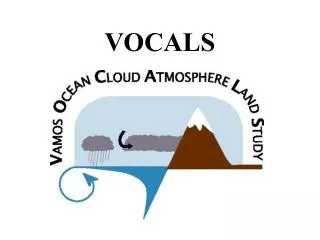
The VOCALS Assessment (VOCA). Matt Wyant, Chris Bretherton, Rob Wood Department of Atmospheric Sciences University of Washington Scott Spak, U. Iowa (Emissions) VOCA modeling groups (without which there’s nothing to say). Pre-VOCA. Wyant et al., 2010, ACP. Low cloud fraction.

E N D
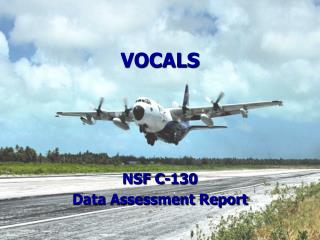
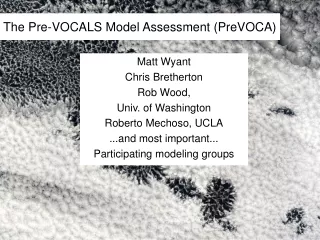
The VOCALS Assessment (VOCA) Matt Wyant, Chris Bretherton, Rob Wood Department of Atmospheric Sciences University of Washington Scott Spak, U. Iowa (Emissions) VOCA modeling groups (without which there’s nothing to say)
Pre-VOCA Wyant et al., 2010, ACP Low cloud fraction BL Depth at 20º S • PreVOCA compared 15 regional, weather forecast, and climate models (in forecast mode) for October 2006 in the VOCALS region. • Many models had large errors in distribution of low cloud cover, though ECMWF and UKMO performed well. • Most models produced a marine BL too shallow near the coast at 20S. • Most models qualitatively captured diurnal and day-to-day variability of the cloud and BL despite mean biases. • Global models outperformed most regional models. Height Longitude
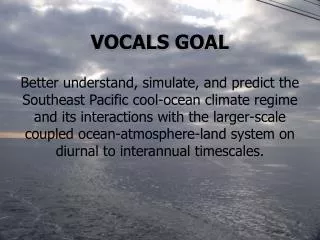
The VOCALS Assessment (VOCA): Motivations • Make use of extensive REx in-situ aircraft/ship datasets • Emphasize chemical/aerosol transport, cloud-aerosol interaction. • Do models simulate the variation of droplet concentration Nd along 20S? • Is anthropogenic sulfate the main contributor to geographic Ndvariation? • What controls Nd in remote ocean regions? • What is the simulated indirect effect due to anthropogenic aerosols perturbing clouds and net TOA radiative flux in the VOCALS domain?
VOCA Overview • Compare aerosol and gas concentrations to in-situ measurements. • Compare cloud-top effective radius with satellite. • Geoengineering experiment: Set Nd = 375 cm-3 everywhere. • Initial results are coming in now. Similar protocol to PreVOCA. RExperiod: 15 Oct -15 Nov 2008. Aerosol Species: SO4, sea salt, dust, black carbon, organic carbon Gas Species: SO2, DMS, CO, O3 Emissions of aerosol and gas species are specified in a standard protocol for regional models.
Participating Models Interactive Aerosols
Monthly-mean results (16 Oct – 15 Nov 2008)Low cloud fraction
In-situ on 20S: 0.1-0.5 mm/d at 80-85W, negligible at 70-75W (Breth et al. 2010).
Interactive aerosols Specified aerosols
Mean 20S cloud fraction cross-section Inv too low at coast: CAM5, GFDL, UKMO Bretherton et al. 2010 Inv somewhat low offshore: GFDL, CAM5
Mean 20S sulfatecross-sections Boundary layer FT obs PNNL, ECMWF good
Mean 20S sea-saltcross-sections • Do we have suitable VOCALS observations? • Caveat: number is as important as mass.
Mean 20S DMScross-sections 1x10⁻¹⁰ kg/kg PNNL much too high, CAM5 and GFDL somewhat high Caveat: observations don’t cover the diurnal cycle
Mean 20S CCN(0.1%)cross-sections Model CCNs mostly too low near coast (except UKMO). GFDL too low everywhere.
Mean 20S Nd cross-sections • Huge differences • GFDL very low, • CAM and PNNL have strange profiles, • UKMO may include clear air • Surprisingly different from CCN fields • Is model output • really the mean in-cloud Nd? Bretherton et al. 2010
Temporal variability Nd observations Bretherton et al. 2010 Models pick up pollution peaks associated with offshore flow, but mean biases are overwhelming (except PNNL)
Conclusions • VOCA is a stringent observational test of model-simulated clouds and aerosol-cloud interaction in SE Pacific. • Results presented here are still preliminary! • The comprehensive REx dataset indicates a diverse set of parameterization issues in all models, hopefully pointing the way to an intensive phase of model improvement.
Emissions Inventory (Scott Spak) • SO2, VOCs, CO • CONAMA Chilean Inventory point sources, municipal mobile, residential sources • SO2 Peruvian smelters and volcano estimates from OMI PBL SO2 • Elsewhere use global inventories: EDGAR FT 2000 and Bond et al. (2004) for black carbon and organic carbon. • Inclusion of daily biomass emissions using MODIS detection of fires from C. Wiedinmyer is being investigated.
mt/year 106 105 104 103 102 10 SO2 Area Sources
mt/year 106 105 104 103 102 10 SO2 Point Sources
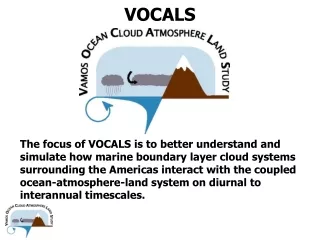
VOCALS: A CLIVAR study of SE Pacific cool ocean/Sc region. REx: Large field expt off N Chile - Oct.-Nov. 2008 - cloud/aerosol/land interactions - role of mesoscale ocean eddiesPreVOCA: Atmospheric model assessment for Oct. 2006 using SE Pac satellite, ship obs.