Magnetic Resonance Imaging
Magnetic Resonance Imaging. Images and text from Curry T., Dowdey J., Murry R.Publisher: Lea & Febiger, Physics of Diagnostic Radiography by Philadelphia 1990, 4th ed. The Image Processing Handbook, Russ, CRC Press. Magnetic Resonance Instrumentation. Magnetic Resonance Imaging.

Magnetic Resonance Imaging
E N D
Presentation Transcript
Magnetic Resonance Imaging Images and text from Curry T., Dowdey J., Murry R.Publisher: Lea & Febiger, Physics of Diagnostic Radiography by Philadelphia 1990, 4th ed. The Image Processing Handbook, Russ, CRC Press
Magnetic Resonance Imaging We must encode the X,Y, Z location and proton density Of each voxel Signal localization is based on adding a magnetic field gradient onto the main (constant) magnetic field. Along the gradient, a unique magnetic field strength corresponds to each location.
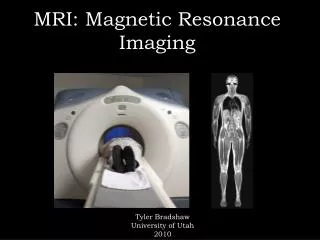
The patient is placed in a strong, 2T, horizontal magnetic field The magnetic field varies slightly from feet to head. An RF transmitter transmits a frequency in resonance with the Larmor Precession in a given slice. Slice Selection or z gradient
Top Middle Bottom 1.9T 2T 2.1T w0t w2t Phase separation ( y gradient) Vertical coils can produce a field gradient The top of the patient’s body sees a higher magnetic field than bottom These coils apply a field gradient causing nuclei in slightly different fields to precess faster and advance in phase.
Detection ( x gradient) A final set of coils produces a field gradient from left to right. The nuclei in higher magnetic fields precess faster and contribute higher frequencies to the detected signal.
The imaging procedure • 1. Apply z-gradient. • Cross section along the z-axis has a different Larmor frequency. • 2. Flip the nuclei in a selected by applying a 90-degree RF signal • with correct frequency. • 3. Switch off z-gradient and apply y-gradient to move nuclei out of • phase by amount related to differing Larmor frequencies ( ie. • Magnetic field dependent) • 4. Apply x-field gradient and detect FID signal. FID will be • modulated at Larmor frequency of x-position of source nuclei. • 5. Perform Fourier analysis to determine signal strength at each • phase shift ( y position) and Larmor frequency ( x-position) • Repeat for different RF frequencies ( z-position)
Two-dimensional image formation The use of a single 90o flip has problems It is difficult to identify the maximum intensity of the FID We therefore use sequences of 90o and 180o sequences
Pulse sequences use: • different strength, • order, • duration • repetition of RF pulses and magnetic gradients • The pulse sequence chosen determines the contrast observed in the resultant MR image. • Image contrast is markedly influenced by tissue differences in Ti, T2, and proton density. • The most commonly used pulse sequences in clinical imaging are • ·spin echo (SE) • · inversion recovery (IR) • ·gradient recalled echo(GRE) Common pulse sequences
Spin echo • 90-degree pulses rotate the magnetization vector • Rapid dephasing (T2* effects). • 180-degree pulse Spin rephasing at a time TE/2 • Echo detecion at time TE • The sequence is repeated with a repetition time (TR), which is the time interval between successive 90-degree pulses.
Spin echo weighting • SE sequences can be modified to emphasize • T1 differences (T1 weighting) • Tissues with short T1 values appear bright on T1-weighted images. • T2 differences (T2 weighting) • Tissues with long T2 values appear bright on T2-weighted images. • proton density differences • Proton density weighted images demonstrate little intrinsic contrast • because of the small variations (approximately 10%) in proton • density for most tissues
T1-weighted images • Obtained with • short TR (less than 600 ms) to emphasize T1 differences • and • short TE (less than 20 ms) to minimize T2 differences
T2-weighted images Obtained with a long TR (more than 2000 ms) to minimize T1 differences, because all tissues exhibit full relaxation, and a long TE (more than 90 ms) to emphasize T2 differences.
Proton density image • Proton density weighted images are obtained with • long TR (more than 2000 ms) to minimize T1 differences • short TE (less than 20 ms) to minimize T2 differences.
Fast spin echo (FSE) Resemble multiecho SE sequences But change the phase-encoding gradients for each echo. The number of repeat pulses separated by time TR is greatly reduced with a corresponding reduction in imaging time. FSE shortens acquisition time by applying multiple phase-encoding steps and 180-degree echoes after every 90-degree pulse.
Inversion recovery • 180-degree pulses to invert the magnetization vector. • Longitudinal magnetization vector recovers with a time constant T1, and complete recovery occurs after a time of 5 x T1. • 90-degree (readout) pulse after time TI (inversion time) to flip the relaxed spins into the transverse plane. • Second 180-degree pulse at time TE/2 produces an echo at time TE • The size of the signal obtained with the readout pulse is strongly dependent on the value of T1 and TI. • IR emphasizes T1 differences, and tissues with short T1 values produce high-intensity signals.
Gradient recalled echoes Use short TRs, short TEs, and low flip angles. Allows fast acquisition times and permits three-dimensional imaging within reasonable times. Sequences may use TRs of only 5 ms, and 256 acquisitions can be acquired in 1.3 seconds. HE imaging relies on reversing the polarity of the magnetic field gradients instead of 180-degree refocusing of HF pulses to generate echoes. This is accomplished by reversing the polarity of the magnetic gradient to rephase the spins and generate an echo FID signal. Short TE values emphasize T1 differences between tissues.
180 90 90 GRE Echo Planar Pulse Components • Gradient Echo--Echo Planar • 2D sequence • Acquires multiple phase encoding values per TR period • 90 degree excitation pulse • Gradient rephase pulse • Gradient reversal to collect phase encoding values
Image Quality Matrix sizes of 128 x 256, 192 x 256, 256 x 256, or 256 x 512 Each pixel needs 12 to 16 bits to code the pixel intensity level, MR images have image contents ranging from 0.06 to 0.25 MB. The MR imaging parameters selected determine the trade-offs that influence contrast, noise, resolution, and acquisition time. QA tests may measure section thickness, resolution, SNR, field uniformity, gradient linearity, spatial distortion, and image contrast.
Image contrast • Depends on the • type of pulse sequence • tissue characteristics (differences in T1 and T2 relaxation times). • · Tissues with short T1 are bright on T1-weighted images. • · Tissues with long T2 are bright on T2-weighted images. • · Proton density weighted images show little contrast • Image contrast may be modified by the administration of contrast agents such as gadolinium-DTPA.
Signal-to-noise ratio • The S/N affects the acquired image quality. • The S/N is increased by • increasing slice thickness, decreasing matrix size, and reducing HF bandwidth. • High magnetic fields • S/N increases as the square root of the number of image acquisitions • The trade-off for increased SNR and the resultant improved image quality is an increase in imaging time.
Resolution The spatial resolution achieved on MR systems is determined by the FOV and matrix size, which is typically 1282 to 2562. Pixel size equals the FOV divided by the matrix size and is approximately 1 mm for head images and 1.4 mm for body images. Higher resolution may be achieved by using stronger gradients and more phase-encoding steps. The trade-offs for improved resolution include loss of signal intensity and increases in image acquisition time.
Artifacts Magnetic resonance artifacts Artifacts are areas of high or low signal intensity or distortion in the image They can simulate or mask anatomic structures or pathologic conditions It is important to be able to differentiate MR artifacts from both normal anatomy and pathologic condition.
Artifacts Chemical shift artifacts Chemical shift artifacts are caused by the slight difference in resonance frequency of protons in water and in fat. Molecular structure and local magnetic environment differences cause protons in fat and water to have slightly different resonance frequencies. Chemical shift artifacts can result in light and dark bands at the edges of the kidney or the margins of vertebral bodies.
Artifacts--Chemical Shift Chemical shift results from different the chemical environments of fat and water Water protons are deshielded by oxygen nuclei Fat protons are shielded by carbon nuclei Fat and water protons precess at slightly different frequencies The shift increases as the field strength increases GE Medical Systems--TiP Training in Partnership
Artifacts--Chemical Shift The black banding at fat/water interfaces in the frequency direction is caused by chemical shift Place P/F carefully and consider the effect on fat/water interfaces when selecting BW GE Medical Systems--TiP Training in Partnership
Artifacts • ·Patient motionI common because of the long image acquisition times. • Patient motion results in ghost images that normally appear in the phase-encode direction due to mismapping of measured signals. • Respiratory gating or phase reordering may be used to minimize motion artifacts in body imaging. • Flows • Flowing blood and cerebrospinal fluid also result in MR image artifacts. • ·Magnetic field inhomogeneity • have a significant impact on GRE and other fast imaging techniques.
Artifacts--Motion Voluntary and involuntary patient motion causes phase ghosting artifacts • Protons that move during the • time lapse between phase • encoding and readout • experience a phase shift and • become mismapped in the • phase direction of the image Place P/F carefully and use imaging options to control motion GE Medical Systems--TiP Training in Partnership
Artifacts--Motion Control--RT Respiratory Triggering collects data during the “quiet” phase of the respiratory cycle to minimize respiratory ghosting • Triggering is more effective • than compensation Use RT when breath holding is not possible GE Medical Systems--TiP Training in Partnership
Artifacts • Aliasing or wrap around • Artifacts occurs when the FOV is smaller than the structure, Imaged objects outside the FOV are mapped to the opposite side of the image. • Aliasing is generally caused by nonlinearities in field gradients or undersampling of the acquired image data.
Artifacts--Motion Control--ECG Cardiac Gating can “freeze” the effects of pulsatile motion on the brain and spine or heart Use cardiac gating in the brain, spine, and chest GE Medical Systems--TiP Training in Partnership
Artifacts--Aliasing Aliasing occurs when anatomy extends beyond the FOV • Protons outside the area of • interest become excited • through cross-talk and • produce signal that becomes • mismapped in the image Aliasing is also called wrap-around GE Medical Systems--TiP Training in Partnership
Magnetic Resonance Contrast Agents Paramagnetism, superparamagnetism, and ferromagnetism all act as sources of local magnetic field inhomogeneity. These types of materials produce spin relaxation and may be used as contrast agents. Contrast agents that reduce T1 more than T2 produce hyperintensity on T1 -weighted images and are called positive contrast agents. Contrast agents that reduce T2 more than T1 produce hypointensity on T2-weighted images and are called negative contrast agents.
Magnetic Resonance Contrast Agents Diamagnetism Diamagnetic materials result in small decreases in magnetization relative to the external field and, therefore, have small negative values of susceptibility. Most tissues are diamagnetic with a negative X in the range 10-4 to 10-6. At tissue interfaces, especially between air and bone, changes in magnetic susceptibility result in changes in the local field, which may result in imaging artifacts.
Magnetic Resonance Contrast Agents Paramagnetism Paramagnetism is caused by the presence of unpaired atomic electrons or molecular electrons. When paramagnetic atoms are placed in an external magnetic field, the local (internal) magnetic field is increased. Paramagnetic materials thus have positive values of susceptibility, which are typically approximately 10-3. Paramagnetism has a much larger effect than diamagnetism and results in an enhancement of the local (internal) field. Paramagnetism occurs with chelates of metals such as Cr, Fe, Mn, Co, Cu, Gd, and Dy, as well as with molecular oxygen.
Magnetic Resonance Contrast Agents Ferromagnetism Diamagnetism and paramagnetism are properties of individual atoms or molecules. Ferromagnetism is a property of a large group of atoms The group of atoms in ferromagnetic substances is called a domain. Ferromagnetic substances such as iron, nickel, and cobalt have unpaired electrons that are strongly coupled, resulting in large local fields and high positive susceptibilities.
Gadolinium Enhanced Techniques • Patient positioned with an IV line in situ • Gadolinium chelates shorten the T1 relaxation time • of blood in proportion to their concentration • Image contrast is based on the differences in T1 • relaxation between arterial blood, venous blood & • surrounding tissues • MOTION & FLOW artifacts • largely eliminated • Enables in-plane imaging of vessel • Decrease coverage • Decrease scan time
Multiphase Carotid Screening Left Vertebral Artery occlusion
Magnetic Resonance Contrast Agents Superparamagnetism Small particles of Fe304, less than approximately 350 A consist of a single domain, and are termed superparamagnetic. When placed in an external magnetic field, superparamagnetic particles develop a strong internal magnetization. Superparamagnetic crystals of iron oxide are used for imaging the liver and reticuloendothelial system.
Magnetic Resonance Contrast Agents Contrast agents Gadolirnum~DTPA is an example of a paramagnetic contrast agent. Gadolinium has seven unpaired electrons with magnetic moments approximately 1000 times stronger than the proton magnetic moment. Gadolinium acts as a relaxation agent of nearby protons and reduces T1 significantly and T2 slightly. The overall effect is highly dependent on the concentration of gadolinium. Contrast agents under investigation include complexes of transition elements and rare earth elements such as iron and manganese. Contrast agents are useful for evaluating blood-brain barrier breakdown and renal lesions.
Echo Planar Dynamic Susceptibility Use single-shot, multi-phase EPI sequences to capture T2* shortening effects of Gadolinium in dynamic susceptibility techniques Inject rate of 3-5 cc/sec Gd changes T2* of blood Gd washes out of blood stream
Echo Planar Dynamic Susceptibility Dynamic susceptibility produces a negative contrast and post processing with negative enhancement integrel calculates the area under the curve
Dynamic EPI Dynamic Susceptibility Contrast (DSC) Imaging multi-slice EPI multi-slice EPI multi-slice EPI . . . . . . repeat repeat repeat . . . Time Series Gd washes out of blood stream Gd changes T2* of blood Up to 60 images
Dynamic EPI DSC MR Imaging Extract time-intensity curves Perform mathematical processing Generate functional map + + - + x / FuncTool NEI Map
Dynamic EPI Negative Enhancement Integral (NEI) “Area under curve”, “rCBV” Stroke is Dark
Dynamic EPI Mean Time to Enhance (MTE) “Mean Transit Time” “Arrival time” Stroke is Bright