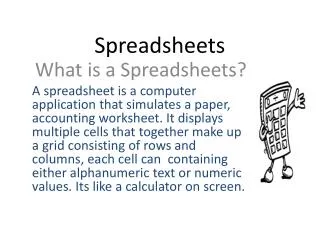
Sensational Spreadsheets
Join Douglas Drover and Donna DesRoches for an engaging session on maximizing Excel's capabilities. This workshop covers everything from essential organization strategies and basic calculations to advanced visualization techniques. Participants will explore databases, learn to track personal goals, and discover how to leverage Excel's features for effective data analysis. Engage in hands-on activities and gain valuable insights that promote student ownership of learning. Don't miss your chance to transform your approach to spreadsheets!

Sensational Spreadsheets
E N D
Presentation Transcript
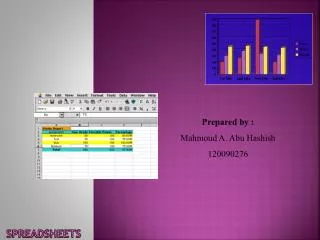
Sensational Spreadsheets Two words you never thought you’d see together Douglas Drover & Donna DesRoches
Morning Agenda • Introductions • Walking through the Excel environment • What’s a database • Excel for Organization • Excel for Calculation • Excel for Visualization • Excel for Personal Goal Trackination • Your Turn
Environment • Rule 1: Don’t be scared. • Rule 2: Know how to undo. • Let’s Go!
Database? • All the data you want to use • Logically organized • Consistent • Error-free
Organization • Tracking • Milk money • Permission forms • Parent contact • Outcomes in course or for students • Tools • Counts • Conditional Formats • Sort • Find / Filter
Calculation • Formulas • Can perform basic arithmetic operation formulas • Roughly 400 pre-programmed functions available • Strictly follows BEDMAS • Can toggle to show formulas • Why? • Removes “busy work” when practice is not the goal • Allows more time for analysis • Still demands student understanding of BEDMAS • Allows students to visually sort and/or “chunk” multi-step problems
Visualization • Why? • Removes “busy work” when practice is not the goal • Allows more time for analysis • Still demands student application of expectations • Supports MI by allowing visual learners quicker access to visual representations • Graphing • 11 different graph types with hundreds of different formats • Linked to cells; instantly update Shading Conditional Formatting Manual shading
Goal Trackination • What? • Allowing students to track their own data to indicate progress towards a goal • Why? • Emphasizes personal reflection • Promotes student ownership of their learning • Students see their data in real time • Students easily share data with the teacher • And… do you really want one more thing to do?
Your Turn • Now it’s your turn! • Build your own chart and table on a topic of your choosing using data from the participants in this room. • It doesn’t matter: • How have our feelings towards Excel changed this morning? • In which areas of instruction do we want more support? • Where do we want to eat lunch today? • Who has the best dance moves? • Just remember to start with a database and end with a chart!