Relationship between Blood Pressure, BMI, and Gender
280 likes | 303 Vues
This homework assignment explores the relationship between blood pressure, body mass index (BMI), and gender. Statistical analyses are used to determine the expected differences in scl (a variable) based on sbp (systolic blood pressure), bmi_who (BMI category), and sex. The results and interpretations are discussed.

Relationship between Blood Pressure, BMI, and Gender
E N D
Presentation Transcript
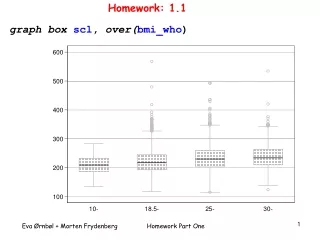
Homework: 1.1 graph box scl, over(bmi_who)
Homework: 1.1 hist scl, by(bmi_who)
Homework: 1.2 xi: regress sclsbp i.sex i.bmi_who • i.bmi_who _Ibmi_who_0-3 (naturally coded; _Ibmi_who_0 omitted) • i.sex _Isex_1-2 (naturally coded; _Isex_1 omitted) • Source | SS df MS Number of obs = 4658 • -------------+------------------------------ F( 5, 4652) = 57.90 • Model | 541580.89 5 108316.178 Prob > F = 0.0000 • Residual | 8702220.78 4652 1870.64075 R-squared = 0.0586 • -------------+------------------------------ Adj R-squared = 0.0576 • Total | 9243801.67 4657 1984.92628 Root MSE = 43.251 • ------------------------------------------------------------------------------ • scl | Coef. Std. Err. t P>|t| [95% Conf. Interval] • -------------+---------------------------------------------------------------- • sbp | .3668708 .0291932 12.57 0.000 .3096382 .4241034 • _Ibmi_who_1 | 10.75396 5.228957 2.06 0.040 .5027261 21.0052 • _Ibmi_who_2 | 19.80449 5.278602 3.75 0.000 9.455925 30.15305 • _Ibmi_who_3 | 19.9348 5.499011 3.63 0.000 9.154134 30.71547 • _Isex_2 | 3.074562 1.301158 2.36 0.018 .5236762 5.625448 • _cons | 162.4893 6.239769 26.04 0.000 150.2564 174.7222 • ------------------------------------------------------------------------------
Homework: 1.3 ------------------------------------------------------------------------------ scl | Coef. Std. Err. t P>|t| [95% Conf. Interval] -------------+---------------------------------------------------------------- sbp | .3668708 .0291932 12.57 0.000 .3096382 .4241034 _Ibmi_who_1 | 10.75396 5.228957 2.06 0.040 .5027261 21.0052 _Ibmi_who_2 | 19.80449 5.278602 3.75 0.000 9.455925 30.15305 _Ibmi_who_3 | 19.9348 5.499011 3.63 0.000 9.154134 30.71547 _Isex_2 | 3.074562 1.301158 2.36 0.018 .5236762 5.625448 _cons | 162.4893 6.239769 26.04 0.000 150.2564 174.7222 ------------------------------------------------------------------------------ sbp: the expected difference in scl between two persons of the same gender and in the same bmi group who differ one unit of sbp. sbp: the expected difference in scl between two persons who differ one unit of sbp, “adjusted” for gender and bmi group in a model without interaction.
Homework: 1.3 ------------------------------------------------------------------------------ scl | Coef. Std. Err. t P>|t| [95% Conf. Interval] -------------+---------------------------------------------------------------- sbp | .3668708 .0291932 12.57 0.000 .3096382 .4241034 _Ibmi_who_1 | 10.75396 5.228957 2.06 0.040 .5027261 21.0052 _Ibmi_who_2 | 19.80449 5.278602 3.75 0.000 9.455925 30.15305 _Ibmi_who_3 | 19.9348 5.499011 3.63 0.000 9.154134 30.71547 _Isex_2 | 3.074562 1.301158 2.36 0.018 .5236762 5.625448 _cons | 162.4893 6.239769 26.04 0.000 150.2564 174.7222 ------------------------------------------------------------------------------ _Ibmi_who_3: the expected difference in scl between a obese (BMI>30 kg/m2)person and a underweight person, “adjusted” for gender and blood pressure.
Homework: 1.3 ------------------------------------------------------------------------------ scl | Coef. Std. Err. t P>|t| [95% Conf. Interval] -------------+---------------------------------------------------------------- sbp | .3668708 .0291932 12.57 0.000 .3096382 .4241034 _Ibmi_who_1 | 10.75396 5.228957 2.06 0.040 .5027261 21.0052 _Ibmi_who_2 | 19.80449 5.278602 3.75 0.000 9.455925 30.15305 _Ibmi_who_3 | 19.9348 5.499011 3.63 0.000 9.154134 30.71547 _Isex_2 | 3.074562 1.301158 2.36 0.018 .5236762 5.625448 _cons | 162.4893 6.239769 26.04 0.000 150.2564 174.7222 ------------------------------------------------------------------------------ _Isex_2: the expected difference in scl between a woman and a man “adjusted” for blood pressure and bmi group.
Homework: 1.4 gen sbp85=sbp-85 char sex [omit]2 char bmi_who [omit]1 xi: regress sclsbp85 i.sex i.bmi_who ------------------------------------------------------------------------------ scl | Coef. Std. Err. t P>|t| [95% Conf. Interval] -------------+---------------------------------------------------------------- sbp_85 | .3668708 .0291932 12.57 0.000 .3096382 .4241034 _Ibmi_who_0 | -10.75396 5.228957 -2.06 0.040 -21.0052 -.5027261 _Ibmi_who_2 | 9.050527 1.420431 6.37 0.000 6.265808 11.83525 _Ibmi_who_3 | 9.180842 2.082415 4.41 0.000 5.098321 13.26336 _Isex_1 | -3.074562 1.301158 -2.36 0.018 -5.625448 -.5236762 _cons | 207.5018 1.627981 127.46 0.000 204.3102 210.6934 ------------------------------------------------------------------------------ The expected value of a woman in bmi group 1 with sbp of 85 is: 207.5 (204.3 ; 210.7) .
Homework: 1.5 ----------------------------------------------------- Variable | model 2 model 1 model 3 -------------+--------------------------------------- sbp | .30695915 .36687077 | .04512031 .02919325 dbp | .14294653 .56887738 | .08209799 .05336439 _Ibmi_who_1 | 10.789224 10.753961 12.068091 | 5.2278549 5.2289572 5.24984 _Ibmi_who_2 | 19.521649 19.804487 21.088467 | 5.2799495 5.2786024 5.300535 _Ibmi_who_3 | 19.37536 19.934802 21.382882 | 5.5071916 5.4990112 5.5259803 _Isex_2 | 3.3445957 3.0745623 4.4458803 | 1.3100858 1.3011578 1.3063581 _cons | 158.66018 162.48929 162.17072 | 6.6146819 6.2397689 6.6265414 -------------+--------------------------------------- N | 4658 4658 4658 df_r | 4651 4652 4652 F | 48.77906 57.903249 48.803315 rss | 8696552.1 8702220.8 8783092.3 ----------------------------------------------------- legend: b/se
Homework: 1.6 gen sbp2=sbp^2 xi: regress sclsbpsbp2 i.sex i.bmi_who i.bmi_who _Ibmi_who_0-3 (naturally coded; _Ibmi_who_0 omitted) i.sex _Isex_1-2 (naturally coded; _Isex_1 omitted) Source | SS df MS Number of obs = 4658 -------------+------------------------------ F( 6, 4651) = 54.38 Model | 605967.501 6 100994.583 Prob > F = 0.0000 Residual | 8637834.17 4651 1857.19935 R-squared = 0.0656 -------------+------------------------------ Adj R-squared = 0.0643 Total | 9243801.67 4657 1984.92628 Root MSE = 43.095 ------------------------------------------------------------------------------ scl | Coef. Std. Err. t P>|t| [95% Conf. Interval] -------------+---------------------------------------------------------------- sbp | 1.59775 .2110625 7.57 0.000 1.183967 2.011533 sbp2 | -.0041604 .0007066 -5.89 0.000 -.0055456 -.0027751 _Ibmi_who_1 | 9.58861 5.213895 1.84 0.066 -.6330964 19.81032 _Ibmi_who_2 | 17.67847 5.271983 3.35 0.001 7.342884 28.01406 _Ibmi_who_3 | 17.76944 5.491547 3.24 0.001 7.003408 28.53548 _Isex_2 | 3.74442 1.301457 2.88 0.004 1.192948 6.295892 _cons | 75.84564 15.9748 4.75 0.000 44.52746 107.1638 ------------------------------------------------------------------------------
Homework: 1.6 gen sbp85=sbp-85 gensbp285=sbp85^2 char sex [omit]2 char bmi_who [omit]1 xi: regress sclsbp85sbp285 i.sex i.bmi_who ------------------------------------------------------------------------------ scl | Coef. Std. Err. t P>|t| [95% Conf. Interval] -------------+---------------------------------------------------------------- sbp_85 | .8904904 .0935662 9.52 0.000 .7070563 1.073925 sbp2_85 | -.0041604 .0007066 -5.89 0.000 -.0055456 -.0027751 _Ibmi_who_0 | -9.58861 5.213895 -1.84 0.066 -19.81032 .6330964 _Ibmi_who_2 | 8.089861 1.424692 5.68 0.000 5.296789 10.88293 _Ibmi_who_3 | 8.180834 2.081859 3.93 0.000 4.099402 12.26226 _Isex_1 | -3.74442 1.301457 -2.88 0.004 -6.295892 -1.192948 _cons | 194.9289 2.681602 72.69 0.000 189.6717 200.1861 ------------------------------------------------------------------------------ The expected value of a woman in bmi group 1 with sbp of 85 is: 194.9 (189.7 ; 200.2). Compared to the result from model 1: 207.5 (204.3 ; 210.7)
Homework: 1.7 ---------------------------------------- Variable | Model5 Model 1 -------------+-------------------------- sbp | .36869988 .36687077 | .02952062 .02919325 bmi | .95112584 | .16530471 _Isex_2 | 2.1519368 3.0745623 | 1.2846256 1.3011578 _Ibmi_who_1 | 10.753961 | 5.2289572 _Ibmi_who_2 | 19.804487 | 5.2786024 _Ibmi_who_3 | 19.934802 | 5.4990112 _cons | 153.75276 162.48929 | 4.8475081 6.2397689 -------------+-------------------------- N | 4658 4658 df_r | 4654 4652 F | 89.305163 57.903249 rss | 8740632.2 8702220.8 ---------------------------------------- legend: b/se
Homework: 1.8 Original scl: residuals in bmi group for both genders.
Homework: 1.8 Original scl:
Homework: 1.8 Original scl:
Homework: 1.8 Ln transformed scl: residuals in bmi group for both genders.
Homework: 1.8 Ln transformed scl:
Homework: 1.8 Ln transformed scl:
Homework: 1.9 gen lnscl=ln(scl) xi: regress lnscl i.sex*sbp_85 i.sex*i.bmi_who i.sex _Isex_1-2 (naturally coded; _Isex_1 omitted) i.sex*sbp _IsexXsbp_# (coded as above) i.bmi_who _Ibmi_who_0-3 (naturally coded; _Ibmi_who_0 omitted) i.sex*i.bmi_who _IsexXbmi_#_# (coded as above) Output omitted ------------------------------------------------------------------------------ lnscl | Coef. Std. Err. t P>|t| [95% Conf. Interval] -------------+---------------------------------------------------------------- _Isex_2 | -.0069177 .0559387 -0.12 0.902 -.1165841 .1027487 sbp_85 | .0009397 .0002133 4.40 0.000 .0005214 .0013579 _IsexXsbp_~2 | .0010241 .0002636 3.88 0.000 .0005073 .001541 _Isex_2 | (dropped) _Ibmi_who_1 | .0647716 .0499277 1.30 0.195 -.0331103 .1626536 _Ibmi_who_2 | .1059682 .0499064 2.12 0.034 .008128 .2038083 _Ibmi_who_3 | .1219232 .0511454 2.38 0.017 .021654 .2221924 _IsexXbmi_~1 | -.0275051 .0558668 -0.49 0.623 -.1370306 .0820204 _IsexXbmi_~2 | -.0288258 .0560541 -0.51 0.607 -.1387183 .0810668 _IsexXbmi_~3 | -.056727 .0577515 -0.98 0.326 -.1699473 .0564933 _cons | 5.273679 .0500274 105.42 0.000 5.175602 5.371757 ------------------------------------------------------------------------------
Homework: 1.10 The interaction _IsexXsbp_1_2 is the difference in coefficient to sbp_85 between the women and men. Lets consider the first BMI group (BMI on reference level): For men the line is as follows: logscl=5.28+0.00093*(sbp-85) For women the line is as follows: logscl=(5.28-0.007)+(0.00093+0.001)*(sbp-85)
Homework: 1.10 The interaction _IsexXsbp_1_2 is the difference in coefficient to sbp_85 between the women and men. Lets consider the second BMI group : For men the line is as follows: logscl=(5.28+0.065)+0.00093*(sbp-85) For women the line is as follows: logscl=(5.28+0.065-0.007-.028) +(0.00093+0.001)*(sbp-85)
Homework: 1.11 The interaction coefficient _IsexXbmi_2_2 is the extra difference in level between overweight men and women compared to underweight men and women. testparm _IsexXbmi_* ( 1) _IsexXbmi_2_1 = 0 ( 2) _IsexXbmi_2_2 = 0 ( 3) _IsexXbmi_2_3 = 0 F( 3, 4648) = 1.04 Prob > F = 0.3756
Homework: 1.11 Lets consider the first bmi group: For men the level is as follows: logscl=5.28 For women the level is as follows: logscl=5.28-0.007 Then we look at the second bmi group: For men the level is as follows: logscl=5.28+0.11 For women the level is as follows: logscl=(5.28-0.007)+(0.11-0.03)