Download
1 / 35
350 likes | 363 Vues
This overview delves into the elements of the South African LG framework being refined, including revenue sources, infrastructure financing, and service delivery targets. It discusses the budget trends, expenditure patterns, and revenue sources of metros, local, and district municipalities.

E N D
Cities Network Local Government Budgets and Expenditure Review14 November 2006National Treasury
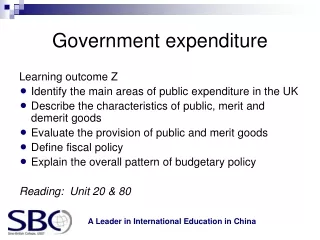
Overview Key elements of LG framework being refined: • Alignment of functions and fiscal powers of category B and C municipalities • Reforms to municipal own revenue sources • Continued assessment of formulae for equitable share and MIG • Assessment of roles of municipalities and provinces on housing, health and public transport • Impact of REDS and Water Distribution reforms on local government finances • Appropriate capital finance arrangements for infrastructure e.g. borrowings • MFMA reforms
Overview Building on the successes over the medium term government seeks to ensure that: • Free basic services are provided to all households that cannot afford to pay for such services • A proper waste management system is in place • The bucket sanitation system is eradicated • The built (or spatial) environment develops, with all the necessary infrastructure to bring about sustainable communities • Financial management and the capacity of municipalities to deliver quality services is strengthened • The delivery of municipal infrastructure contributes to job creation • Targets Sanitation or bucket system - 2008 Water – 2010 Electricity – 2012 All others - 2013
Introduction • Local government obliged to structure and manage its affairs • Administration, Planning, budgeting and implementing programmes that give effect to community needs • Budgets are central to the realisation of these needs • Each municipality is responsible for its own budget • Budgets should be balanced (income & expend) • MFMA will assist munis to achieve balanced budget through: • Improved expenditure and revenue planning • Budget execution • Reporting on performance • Obtaining value for money • Support multi year appropriations for capital
Underlying budget trends • Aggregate budgets of munis nearly doubled from R64 billion to R119 billion in four years • Slow start, decline noted during 1998/99 • Increases since then largely driven by capital expenditure which has grown by 22 per cent against 17 per cent growth in operating expenditure over the same period • Capital budgets rose from R12 billion in 2001/02 to R26 billion in 2005/06 • Increase fuelled by increased grants from R2.3 billion (19%) in 2001/02 to R6.4 billion (38%) in 2005/06 • Operating budgets rose from R53 billion in 2001/02 to R93 billion in 2005/06
Underlying budget trends (cont) • Operating budgets in 2005/06 funded by: • Electricity sales – R24.3 billion or 26 per cent • Property Rates – R17 billion or 18 per cent • Grants and subsides – R13.2 billion or 14 per cent • Water tariffs – R11.2 billion or 12 per cent • Refuse, levies, fines etc – R28 billion or 30 per cent • Capital budgets is funded by: • Grants and subsidies – R13.3 billion or 51 per cent • Internally generated funds – R5.9 billion or 23 per cent • Borrowings – R4.4 billion or 17 per cent • Others – R2.4 billion or 9 per cent
Underlying budget trends (cont) • Metropolitan municipalities make up 57 per cent or R68 billion of the combined local government budget • Local municipalities account for 34 per cent or R41 billion • District municipalities account for 9 per cent or R10 billion • Operating budget of metros are double the size of local’s and seven times those of districts • Capital budgets of metros are 1.3 times the size of local municipalities and 4 times higher than those of districts • The ratio of operating to capital budgets are: • 4.3:1 for metros, 3.1:1 for locals and 2.4:1 for districts • Note that metros and local municipalities have larger trading activities than districts
Expenditure and Revenue trends for metros • Expenditure on capital projects almost trebled from R2.5 billion in 2001/02 to R7.3 billion in 2004/05 • Capital expenditure growth to moderate in the medium term because the budgets exclude major projects e.g. World Cup 2010 • Expenditure on infrastructure makes up almost 80 percent of the total capital budget for metros • External loans are used to fund most of the capital projects of metros, this amounts to 53 per cent in 2004/05
Expenditure and Revenue trends for metros (cont) • Operating Expenditure almost doubled from R23 billion to R48 billion over the same period and is set to increase annually by 3.1 percent to R59 billion in 2007/08 • Metropolitan municipalities spend an average of : • - 29.6 per cent on salaries and wages • - 24 per cent on bulk services • - 39 per cent on general expenses, interest, redemption of loans etc. • - 7.4 percent on repairs and maintenance • Expenditure on bulk electricity and water showed an annual growth of 41.5 per cent for the period 2001/02 to 2004/05
Expenditure and Revenue trends for metros (cont) • Revenue from user charges increased by 29.7 per cent annually from R9.3 billion in 2001/02 to R20.3 billion in 2004/05 • Property rates revenue account for 23 per cent of total revenue, and has seen an annual growth of 21.3 per cent annually from R6.5 billion to R11.6 billion between 2001/02 and 2004/05 • The new Municipal Property Rates Act will bring about significant changes to how property rates are raised • RSC Levies accounted for 7 per cent of revenue raised, and were about R4 billion in 2004/05 • Outstanding consumer accounts has increased from R12 billion in 2002/03 to R23 billion in 2004/05 • Outstanding consumer accounts over 90 days amount to R19 billion or 82 per cent of the total in 2004/05
Expenditure and Revenue trends for Local Municipalities • Capital expenditure budget for local municipalities increased annually by 30.2 per cent from R2.9 billion in 2001/02 to R6.4 billion in 2004/05 • The budgets for the outer years show growth progressively increasing to R10.9 billion in 2007/08 • Expenditure on infrastructure averages 80 percent of the total capital budget for local municipalities • Grants and subsidies fund most of the capital projects of locals, this averages 62 per cent in 2005/06 and the trend continues in the outer years
Expenditure and Revenue trends for locals (cont) • Operating Expenditure have increased by 16.8 per cent from R17 billion in 2001/02 to R27 billion in 2004/05 and it is set to increase annually by 5.1 percent to R34 billion in 2007/08 • Local municipalities spend an average: • - 35 per cent on salaries and wages • - 24 per cent on bulk services • - 34 per cent on general expenses, interest, redemption of loans etc. • - 7 percent on repairs and maintenance • Expenditure on bulk services and personnel showed an annual growth of 16.2 per cent for the period 2001/02 to 2004/05
Expenditure and Revenue trends for locals (cont) • Revenue from user charges increased by 12.2 per cent annually from R8 billion in 2001/02 to R11.3 billion in 2004/05 • Property rates revenue account for 16 per cent of total revenue, and has seen an annual growth of 15.3 per cent annually from R3 billion to R4.6 billion between 2001/02 and 2004/05 • Outstanding consumer accounts has increased from R8.6 billion in 2002/03 to R13.4 billion in 2004/05, an annual growth of 15.9 percent • Outstanding consumer accounts over 90 days increased annually by 20.2 per cent from R5.7 billion in 2001/02 to R9.9 billion in 2004/05 or 74 per cent of the total in 2004/05 • Provision for bad debts showed an increase from 19 per cent in 2001/02 to 22 per cent in 2004/05
Emerging Issues • How do we deal with increasing dependence on national grants and subsidies for funding capital on the one hand and the concept of developmental local government on the other? • What can be done to improve the debt collection among municipalities, given the growing demand for services? • Whether municipalities with strong balance sheets are able to exploit borrowing for expansion of capital programmes?
Emerging Issues • How can we increase the pace of capital spending to grow the economy? • How can we ensure that greater performance of officials to improve service delivery and eradicate backlogs? • New information on 2006/07 budgets to be released shortly, posted on NT website, with s71 first quarter results.
Personnel - Employees Of the 1.6 million people employed in the SA public sector in 2005, over 180 000 were employed by 283 municipalities across all three municipal categories
PERSONNEL EXPENDITURE For 2005/06, municipalities budgeted R23,9 bn on salaries, wages and allowances (i) The R23,9 billion accounted for 25,6% of the combined municipal operating budget of about R93,3 billion (ii) The six metro's personnel expenditure accounted for 63,3% of total personnel expenditure
1400 1200 1000 800 Remuneration R’000 600 400 200 A B C Maximum 1 257 997 1 304 929 Minimum 155 475 Category
QUALIFICATIONS OF SENIOR MANAGEMENT PERSONNEL BY SECTOR/TYPE
WORK-RELATED EXPERIENCE OF SENIOR MANAGERS 278 senior municipal officials surveyed • 4 officials or 1,4% had work-related experience of between 32 to 40 yrs • 170 official or 61.2% had work-related experience of between 5 to 30 yrs • 104 official or 37.4% had work-related experience of 0 to 5 yrs
CAPACITY BUILDING INITIATIVES • Level 5 and 6 SAQA accredited programme • Certificate in Municipal Finance management • NT supported training • Municipal budgeting • Reporting • Supply Chain Management • Internship programme (in chapter 6)
MFMA implementation priorities • Accounting Officer appointment • Top (Senior) Management team and steering committees • Banking and cash controls • Meeting financial commitments • In-year budget reporting and adjustment budgets • Supply chain management • Entities and long-term contracts • Outstanding financial statements • Annual Report and oversight committees • Membership of tender committees, boards & forbidden activities • Internal audit and audit committee establishment Ensure basic structures, processes and systems are put in place and provides the foundation for better information and implementation.
Improvements in budgeting • Many municipalities show improvement in the following elements of budgeting: • Multi-year budgets • Approval of budget before 1 July • Integration with IDP • Service delivery and budget implementation plan • Consultation with community & governments • Documentation, content and quality
Budget Reform Survey of 22 municipalities for 2006 • 10 early tabling of budgets before February • 12 tabled budgets in March • 20 fully integrated multi-year capital budgets with IDP’s • 17 partially integrating multi-year operating budgets
Reporting Monthly budget reports submitted to Mayor and quarterly to the council (173 muni) 2004/05 … 70% complied 2005/06 … 90% complied Challenges: • Financial management systems to be updated • Quality and timing of reports to be improved • Regular posting of relevant information on municipal websites • Recovery of outstanding consumer accounts • Completion of asset registers
Reporting • Preparing quality Annual Reports that talk to performance against budgets need to be expedited • Improvements in financial disclosure and non financial information • Tabled in Council by January • Council to adopt an oversight report within 2 months • Improvements noted in eThekwini, Ekurhuleni, Tshwane, Johannesburg, Buffalo City, Klerksdorp and Emnambithi • Table 6.4 Annual report and audit status (2004/05) for 22 selected municipalities • AFS, 13 submitted on time, 10 audit reports received (5 qualified, 3 unqualified, 2 disclaimed), • Annual Reports, 9 on time, 3 one month late, 4 later than one month, 6 not yet Challenges: • Failure to plan for changed legal framework
Reporting • Annual Financial Statement required to be submitted by 31 August each year • 126 submitted by 31 August 05 • 141 submitted between September and June 06 • 17 outstanding as at 30 June 06 • No improvement with entities • Backlogs are being cleared for 2001/02 – 2003/04 • 87 AFS outstanding prior to 2004/05 (annex I AG report) • Project management is a key challenge • 10 Entities for 2004/05 appointed own auditors, in contravention of MFMA • Grants withheld or delayed to 18 municipalities for non-compliance Challenges: • Quality of AFS submitted to Auditor-General • Delay in submission to Auditor-General • Consolidation of entities • Clean up records • Conversion to GRAP from old systems • Preparation of Asset Registers • Filing of records
2004/05 Annual Financial Statements submitted to the Auditor-General
Oversight role of council • Focus on improvement in performance information and public accountability for 2006 and 2007 • Publication of oversight report on Annual Report • Council consideration of quarterly in-year reports (s71) • Table 6.5 selected 22 muni for 2005/06 - 20 Q1, 18 Q2 • Formal mid-year assessment to prepare for adjustment budget (s72) • Table 6.5 selected 22 muni – 16 produced during Jan/ Feb 06 • Oversight report on website of council Challenges: • Formation of Oversight Committees
Measuring performance Household Impact evaluation / Customer satisfaction Objective Indicators • Measure availability, affordability and access of services • Measure variability across wards • Target intervention measures Subjective Indicators • Measure reliability, satisfaction with services • Individual and collective expectations • Identify gaps for further support • Combine with income and expenditure analysis Challenges: • Developing systems to measure performance • Non-financial indicators • reporting
Reforms • Audit committee and Audit unit • Must be established in all municipalities and entities • In the interim - sharing of audit committees encouraged • Independent credit ratings • Encouraged to obtain credit rating • Can lead to cheaper borrowing costs • 6 metro and top 9 municipalities good credit standing • Municipal S.C.M. Regulations phase-in • 1 July 05 (high), 1 Jan 06 (medium), 30 June 06 (low) • Three committee system (Specification, Evaluation, Adjudication) • All muni to have policy and delegations • New Municipal PPP Regulations commenced on 1 April 05 • NT ppp desk established • Project funding for feasibility studies • Examples • Maluti-a-Phofung water service • Tshwane office accommodation
Reforms Data Collection Project • Improve data quality, content, timing • Common set of financial and non-financial data • Eliminate duplication and effort by municipalities • Promote sharing of common information amongst government departments and other stakeholders • Stakeholders represented • Statistics SA • Reserve Bank • Dplg • Financial & Fiscal Commission • National Treasury • Other national and provincial departments
Emerging issues • How can we raise capacity levels and enhance skills? • How can we ensure integration of plans and budgets? • What needs to be done to ensure quality, timeliness and relevance of reports and information? • How can we get more all municipalities to publish own information on websites? • Available additional support and information - website www.treasury.gov.za/mfma