Download
1 / 55
550 likes | 693 Vues
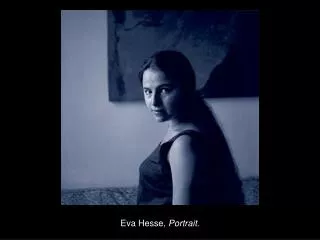
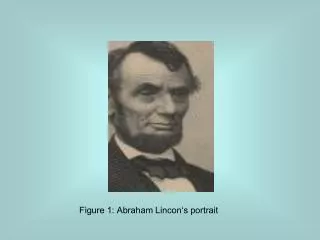
Figure 1: Abraham Lincon‘s portrait. Figure 2: Salvator Dali‘s Gala Contemplating the Mediterranean Sea. Figure 3: Salvator Dali‘s Gala in black and white and therefore with less information. From a distance or nictitating will help to recognize Abraham Lincoln‘s portrait. Laue Geometry.

E N D
Figure 2: Salvator Dali‘s Gala Contemplating the Mediterranean Sea.
Figure 3: Salvator Dali‘s Gala in black and white and therefore with less information. From a distance or nictitating will help to recognize Abraham Lincoln‘s portrait.
Laue Geometry Capillary or Foil X-ray Detector absorption Bragg-Brentano Geometry 2θ-shift X-Ray Detector hight Figure 4: The two essential geometries for PXRD instruments
Figure 6: Sketch of plate-like crystals in an arabitary orientation.
0 0 1 26 1 1 0 38 -2 0 1 15 -2 1 1 12 2 1 0 9 2 0 0 -1 1 1 11 -1 1 2 -2 0 2 2 Figure 8: PXRD pattern of naphthalene in transmission (red) and in Bragg-Brentano geometry (blue), demonstrating the large differences due to texture effects. The 100% peak is the (001) for the blue line and the (110) for the red line.
Figure 9: PXRD pattern of naphthalene in transmission (red) and derived from single crystal data (blue). The almost perfectly matching data demonstrate the superior properties of the transmission pattern for compounds with significant textures.
Rel. Intensity Black: solvent-free Green: 2 hours Blue: 23.4 hours Red: 73 hours Standard peak 2θ (°) Figure 10: Storage of a API in methanol atmosphere, taking up the solvent like a sponge and changing the lattice constants, evident by 2θ shifts of the peaks, whereas a refernce peak from an added internal standard remains constant.
Rel. Intensity Black: solvent-free Green: 2 hours Blue: 23.4 hours Red: 73 hours Shifts to smaller 2θ Shift to larger 2θ Shifts up to 0.3° ! 2θ (°) Figure 11: Section of the previous pattern: by incorporating the solvent, most of the peaks shift to smaller 2θ values corresponding to an expansion of the cell axes, but also shifts to larger 2θ values occur.
dimorphic non-solvated Changes of morphology by uptake of solvents isomorphic solvate isomorphic solvate dimorphic solvates Figure 12: Polymorphy, isomorphy and solvates. The cell dimensions left and right are basically different (dimorphic), Although isomorphic on top and bottom they differ more on the left than on the right. Addition of solvent can lead from top left to bottom right or from top right to bottom left.
Conformational polymorphism Figure 13: Conformational polymorphism is accompanied by significant conformational differnces of the molecules in both forms.
Figure 14: Solid solutions, the non-stoichiometric complexes require spacial similarities of the otherwise different molecules. The inversion centers have pseudo character because of the superpositioning of both molecules in the XRD structure.
Figure 15: Molecular complexes or co-crystals with fixed stoichiometries. The different molecules usually have complementary character and are weakly bonded to each other. Inversion centers have no pseudo character.
mirror Pro-chiral Chiral R Chiral S Figure 16: A prochiral molecule achieves chirality by exchange or additional features. Here we define the door left (S) or right (R) of the window.
Chiral R Chiral S Mirror Figure 17: Two crystals with enantiomerically pure components. Note that each crystal has no internal mirror symmetry. But the external morphology of the two crystals exhibit mirror symmetry. Both forms are optically active in opposite directions.
mirror Chiral S Chiral R meso-form Figure 18: Two different enantiomers combined in equal ratios in one molecule leads to the meso form. Such a molecule has the optically activity cancelled out.
Chiral R Chiral R Back side of the house! 2-fold axis Figure 19: A 2-fold axis at a molecules does not chance chirality, after symmetry operation we only view at the back side.
Two-fold axis! S-Enantiomer Figure 20: 2-fold axes, here perpendicular to the viewing plane (indicated by the black oval), leave all molecules in the same chirality, optically active.
Chiral R Mirror Chiral S Figure 21: Racemic twins have opposite chiralities, separated by a mirror plane at which the crystals are attached to each other. The overall optical activities cancel out, but are detectable in the separate crystal domains.
mirrors Inversion centers Figure 22: Racemic crystals have both enantiomers within one crystal in equal amounts.
No mirrors, S-enantiomers mirror Ratio R:S = 8:12 Figure 23: Racemic conglomerates have an unequal ratio of the enantiomers in domains, mixtures of crystals or sticking together. This causes an overall optical activity.
Basic rules • The 2-Theta angles (2θ angles, diffraction angles, Bragg angles) at which signals are observed, determine the cell dimensions. • The cell dimensions describe the smallest units of a 3-dimensional lattice of a crystal, which contain all the atoms of the compounds. The unit cell can contain several symmetry related molecules or ions. • The contents of the cell, i.e. positions of atoms which is equivalent to the structure of the molecules and the symmetry relations affect the intensities of the signals. Heavy atoms cause higher intensities. Some intensities can be systematically extinguished due to symmetry relations
Convolution of Patterns Diffraction angles: • Alignment mistakes (zero, hight, …) • Contamination with auxilaries, standards or material of sample holder • Decomposition or loss of solvent Diffraction intensities: • Textures (shape of crystals, orientation, sample preparation) • Influence of diffraction geometry (Laue, Bragg-Brentano) • Absorption of heavy atoms
Convolution of Patterns Difficulty of structure determination from powder patters • Reduction of a three-dimensional to a one-dimensional problem • Number of signals versus parameters too small • Intensities convulated due to texture Advantage of structure determination from single crystals • Reduction of a three-dimensional to a two-dimensional problem only • Number of signals versus parameters generally extremely high • detailed structure determination possible However: The single crystal structure determination requires a single crystal with the approximate minimum size of 1/10 mm A single crystal structure allows to derive the non-convulated powder pattern for comparison!
Polymorphism, Isomorphism, Pseudopolymorphism Compounds having the same chemical composition, but different crystal forms not the external shape or morphology! internal packing, contacts and symmetry
Polymorphism, Isomorphism, Pseudopolymorphism Compounds having slightly different chemical compositions but similar crystal forms in terms of cell dimensions and symmetry
Polymorphism, Isomorphism, Pseudopolymorphism Compounds having the same chemical compositions but additional solvent molecules and different crystal forms not necessarily! They can also be isomorphous amongst each other and to a solvent-free form.
Poly-morphism Iso-morphism similar cell, different formula same formula, different cell Pseudo poly-morphism Containing solvents
Poly-morphism Iso-morphism same formula different conforma-tion, slightly different cell similar cell, different formula same formula, different cell similar cell, same formula, plus different solvent different cell, same formula, plus solvent Pseudo poly-morphism Containing solvents
Phase transitions possible Poly-morphism Iso-morphism same formula different conforma-tion, slightly different cell similar cell, different formula same formula, different cell similar cell, same formula, plus different solvent different cell, same formula, plus solvent Pseudo poly-morphism Containing solvents uptake / loss of solvent possible
'thermodynamic' and 'kinetic' crystals no phase transition possible higher symmetry phase transition melting point lower symmetry kinetic minima kinetic minimum free energy thermodynamic minimum
'thermodynamic' and 'kinetic' crystals Ostwald's rule no phase transition melting point heating kinetic minima kinetic minimum freeenergy thermodynamic minimum
how to produce thermodynamic crystals melting point cooling kinetic minima • slow cooling • high dilution • gel crystallization • start at high temperature • inhibit kinetic crystals kinetic minimum free energy thermodynamic minimum
how to prove thermodynamic crystals melting point cooling kinetic minima kinetic minimum • DSC heating curves • CSP free energy thermodynamic minimum
herringbone pattern inhibition
molecular complex inhibition
molecular complex inhibition